Figures & data
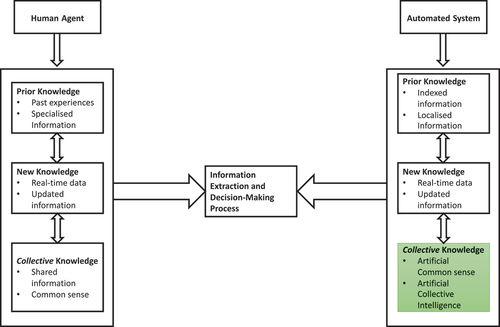
Figure 1. The overall architecture of this approach. All steps and phases are detailed in Sections 4, 5 and 6.
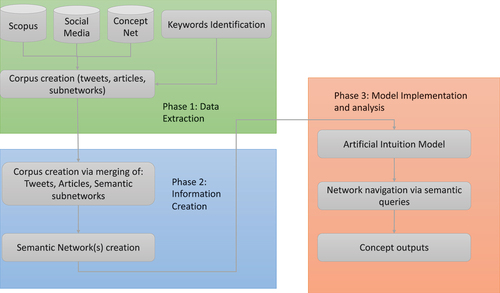
Figure 2. Overview of entrepreneur decision-making process.
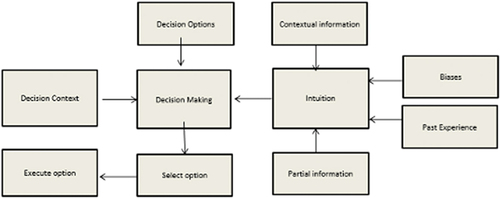
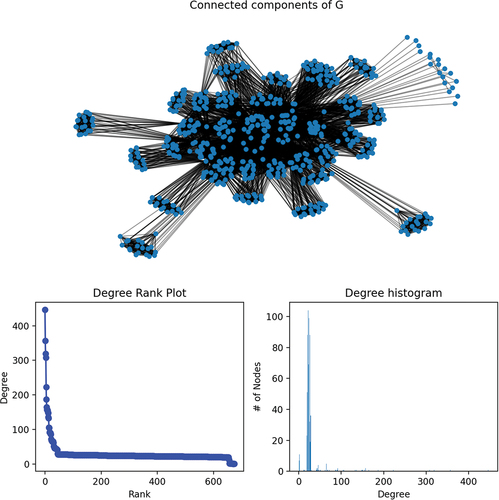
Figure 3. The network and degree distribution of the network defined in Section 5.
Algorithm 1. Solution Assessment Algorithm
Table 1. Research Variables Detailed as per (Bolton and Cullen Citation2022), which were used to inform the creation, query and analysis of the data introduction and discussed in Sections 4, 6 and 5.
Table 2. The experimental results as discussed in Section 7.
Figure 4. The research motivation.