
Figures & data
Figure 1. Principle of hybrid particle swarm.
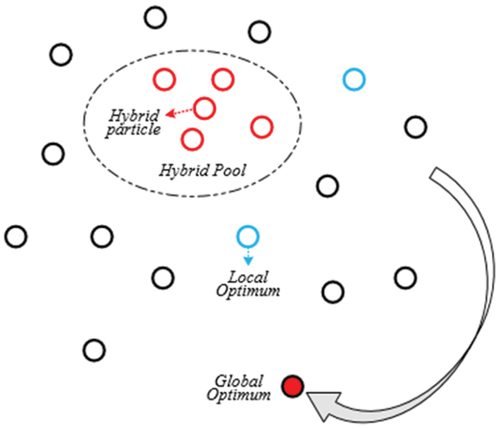
Figure 2. A-star algorithm calculation process.
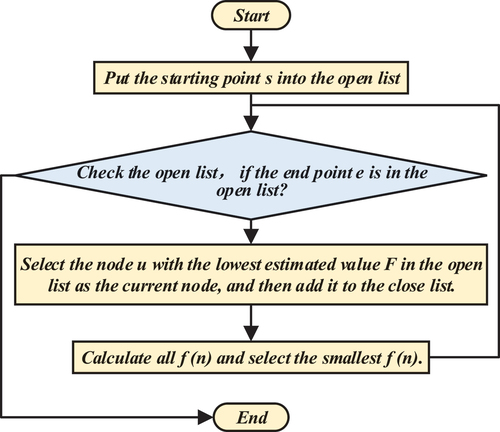
Figure 3. HPSO-A-star hybrid algorithm solution flow chart.
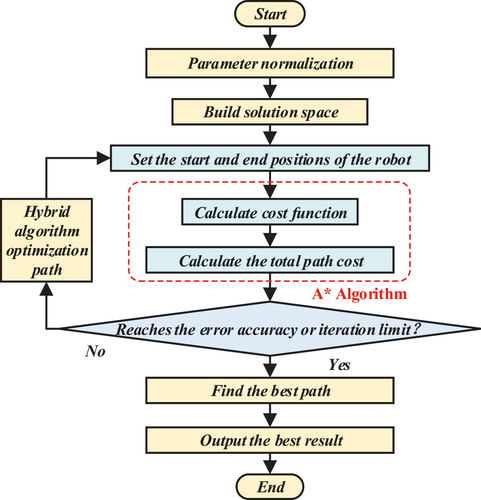
Figure 4. Barrier-free grid map model of 30 patrol points.
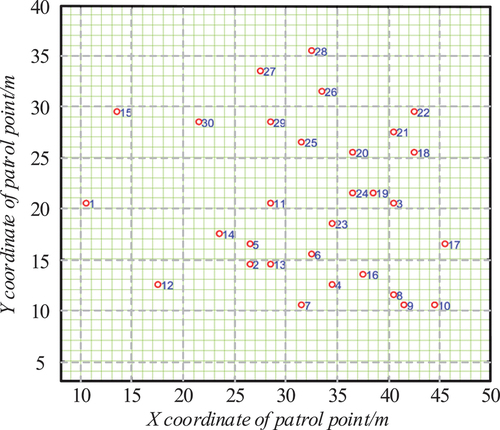
Figure 5. Grid map model of coordinate obstacles of 30 inspection points.
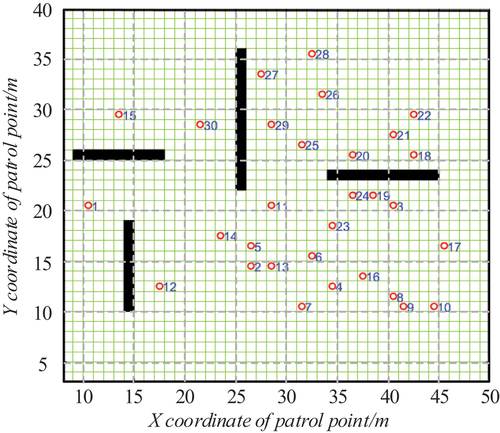
Figure 6. Restriction of freedom of motion of inspection robot.
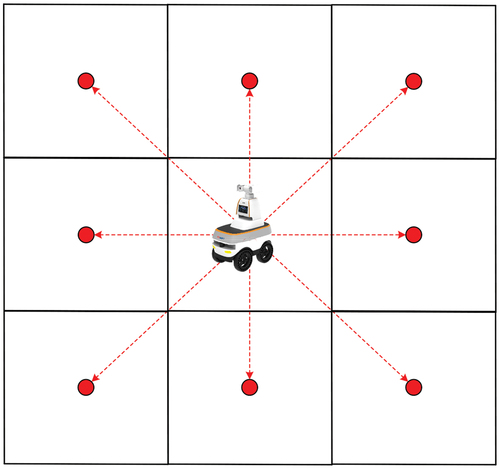
Figure 7. PSO iteration results.
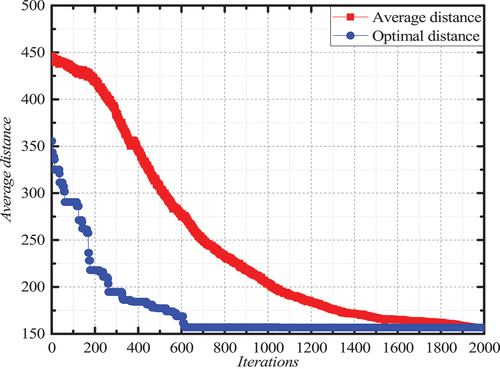
Figure 8. PSO path planning.
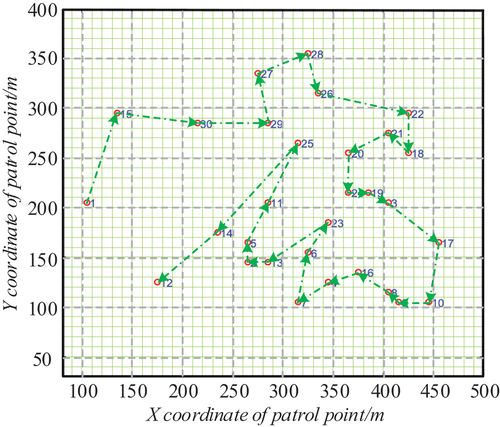
Figure 9. HPSO iteration results.
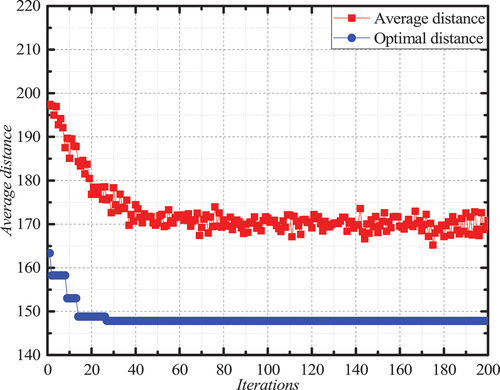
Figure 10. HPSO path planning.
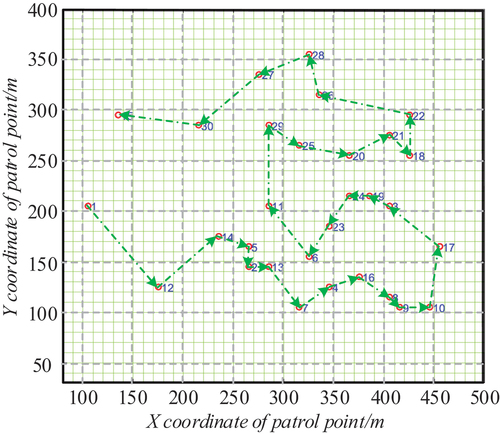
Figure 11. A-star algorithm optimization path from No.1 patrol point to No.12 patrol point.
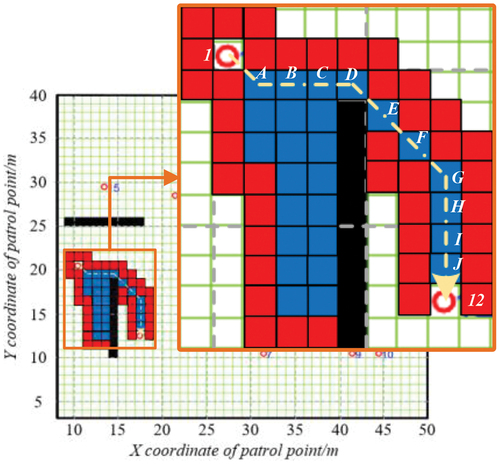
Figure 12. A-star algorithm optimization path from No. 1 patrol point to No. 12 patrol point (grid size reduced).
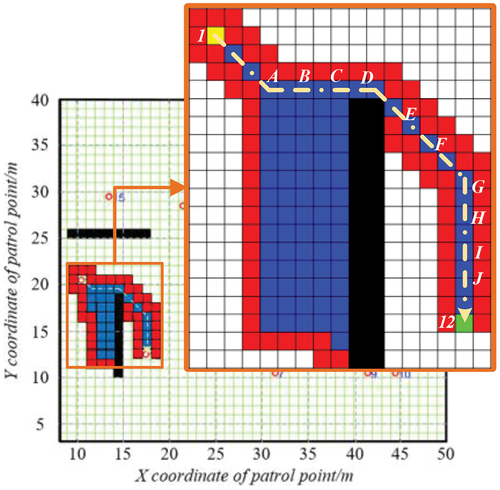
Table 1. Cost table of A-star algorithm optimization path from No. 1 patrol point to No. 12 patrol point/m.
Figure 13. Cloud chart of cost function change in HPSO-A-star training process.
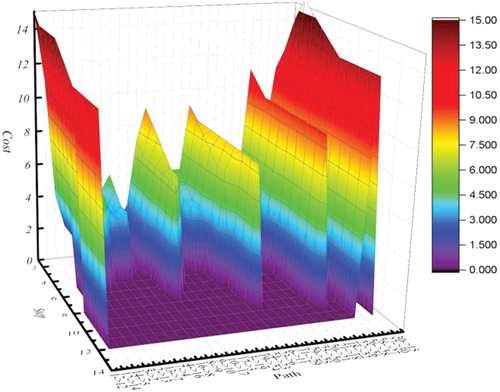
Figure 14. Path diagram of PSO-A-star optimization results.

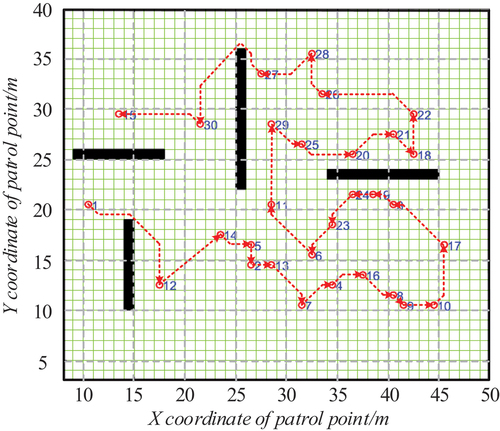
Figure 15. Path Diagram of HPSO-A-star optimization results.
Data availability statement
Due to the nature of this research, participants of this study did not agree for their data to be shared publicly, so supporting data is not available.