
Figures & data
Figure 1. Dental treatment quality evaluation process.
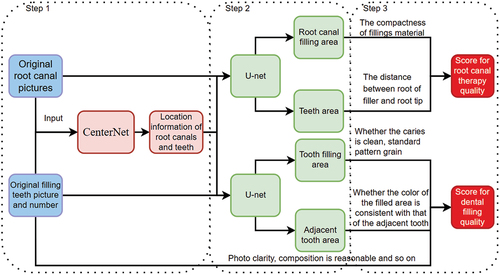
Figure 2. CenterNet network structure.
Figure 3. U-net network structure.
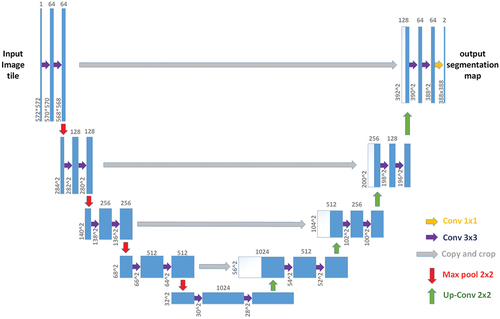
Figure 4. Root canal data set after data augmentation.
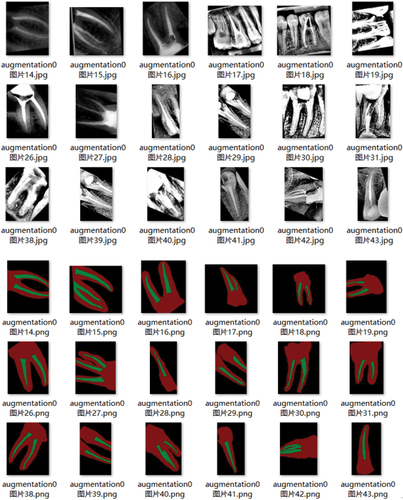
Figure 5. Result of root canal image segmentation.
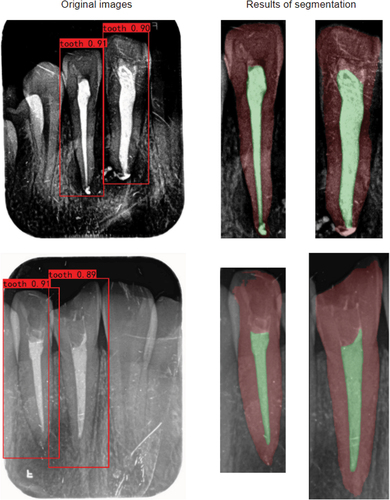
Figure 6. Comparison of preoperative and postoperative images of root canal therapy and filling teeth.
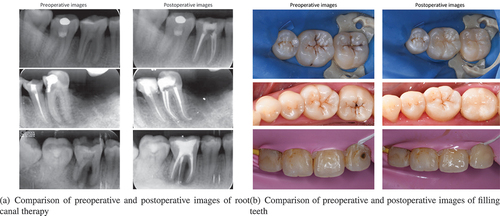
Figure 7. Scoring index graph of filling teeth.
Table 1. The server environment used in the experiment.
Table 2. Comparison of three main feature extraction networks.
Figure 8. The comparison of segmentation effect between marked watershed and U-net.
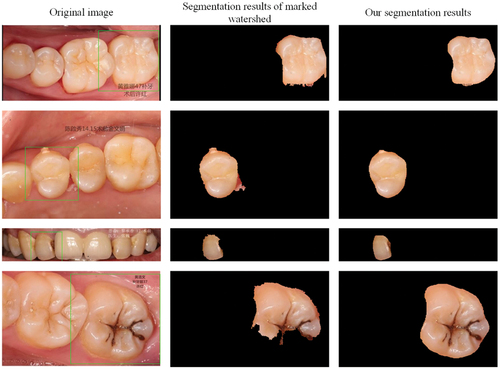
Figure 9. Software scoring interface display.
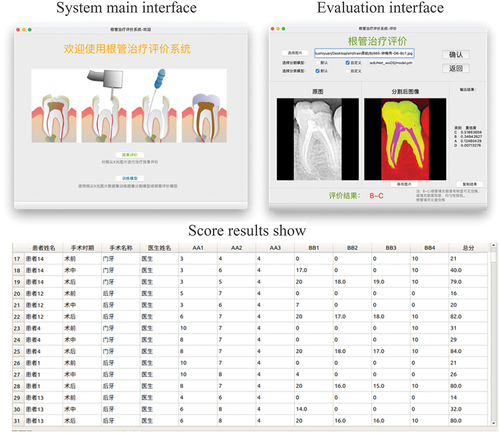
Table 3. Comparison of root canal treatment quality evaluation results.
Table 4. Comparison of dental filling quality evaluation results.
Table 5. Average time-consuming comparison of each picture.