
Figures & data
Figure 1. General methodological diagram.
The flowchart is divided into three main sections, each represented by a different background color. CV Preference of Human Experts (light blue background), Human Level Performance Determination (light green background) and Model for Job-Candidates Matching (light red background).
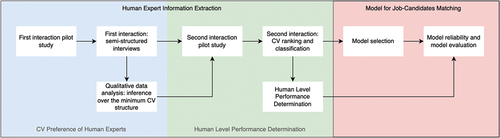
Table 1. Distribution of respondents working in Mexico according to data from the Stack Overflow 2023 Developer Survey in segmentation used for maximum variation sampling.
Table 2. Number of professionals to sample according to maximum variation technique through segmentation criteria of years of experience and number of employees in their current company.
Table 3. Number of interviewed professionals organized according to the criteria of the maximum variation sample.
Table 4. Key names of the CVs used in the different sets of the evaluation experiment.
Table 5. Description of the features that each of the CVs used in the evaluation experiment had to meet.
Figure 2. Baseline model architecture. The represents embedding vectors. Possible values of
are
(job posting), and
(curriculum vitae). The acronym UE stands for “Universal encoder”.
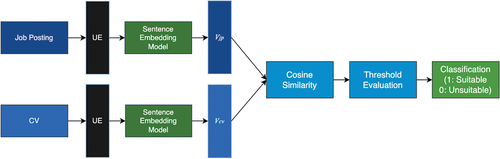
Figure 3. Experimental model architecture. The represents embedding vectors. Possible values of
are
(job posting), and
(curriculum vitae). The acronym UE stands for “Universal encoder”.
The experimental model considers seniority requirements, semantic evaluation, and Choquet integral computation.
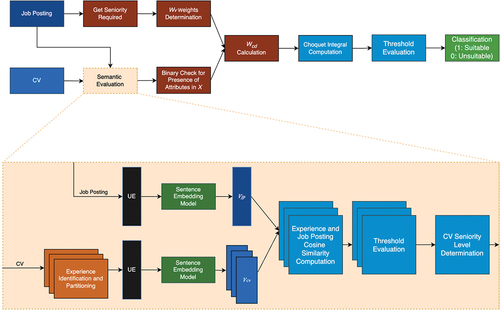
Figure 4. Siamese network architecture used for training the sentence embedding model. The represents embedding vectors. Possible values of
are
(the job anchor),
(the positive example), and
(the negative example). The acronym UE stands for “Universal encoder”.
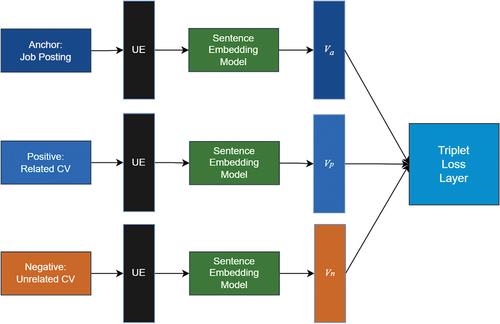
Figure 5. Sentence embedding model architecture.
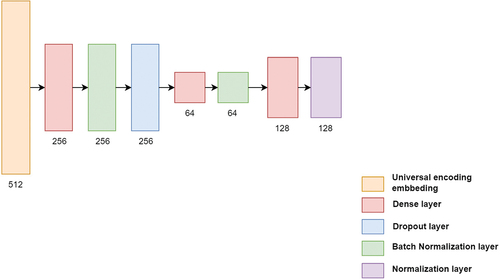
Figure 6. t-SNE 2-dimensionality reduction of the test set’s sentence embeddings with CVs and job descriptions hue by occupational areas.
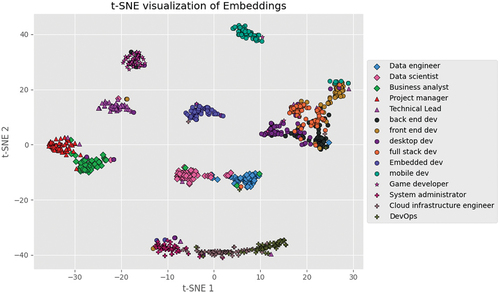
Figure 7. Ranking data’s 2-dimensional singular value decomposition for every set evaluation.
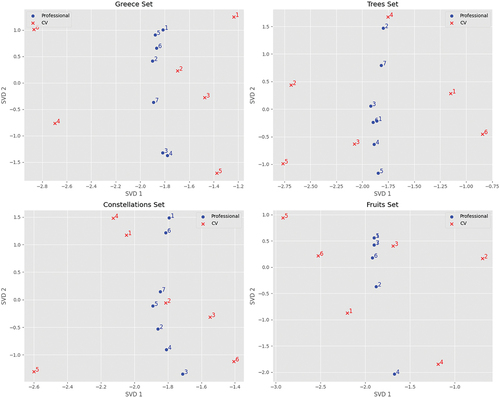
Table 6. Descriptive statistics for analysis of ranking evaluation data. On the top: pair CV frequencies used on the different evaluation sets. On the bottom: marginal frequency distribution for each CV used on the different evaluation sets (RP stands for “Relative Position”).
Table 7. Qualities of the factor space and the reason behind its inclusion.
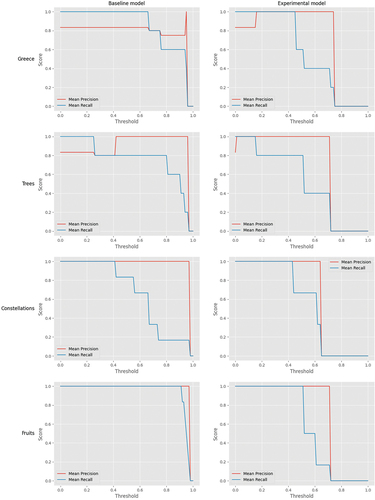
Figure 8. Mean precision and mean recall for the CVs classification as suitable or unsuitable, using baseline and experimental models, for every set evaluation.
Data Availability Statement
The data that support the findings of this study are openly available in figshare at https://doi.org/10.6084/m9.figshare.25127627 and https://doi.org/10.6084/m9.figshare.25127564.