Figures & data
Figure 1. Multi-head self-attention mechanism.
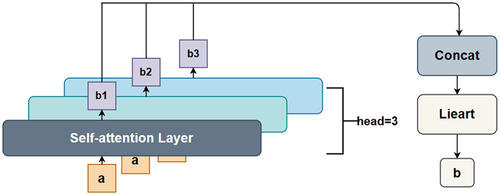
Figure 2. Overview of the proposed MobileDepth.
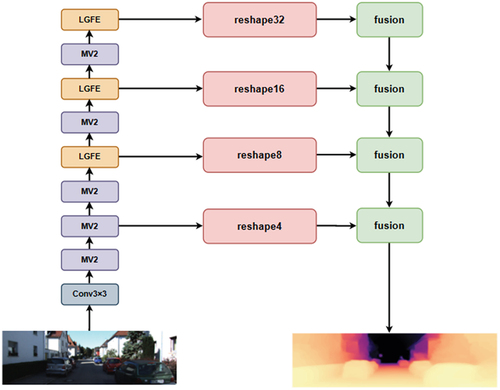
Table 1. Comparison of CNNs-based models and transformer-based models.
Figure 3. Processing of vision transformer.
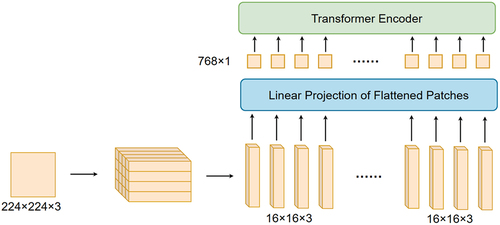
Figure 4. Dilated self-attention block (Dsab)(top) and standard self-attention block(bottom).
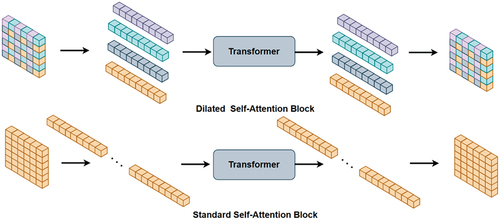
Figure 5. Local and global feature extraction block (LGFE).
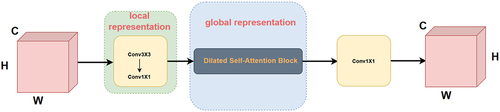
Figure 6. MobileNetV2 block.
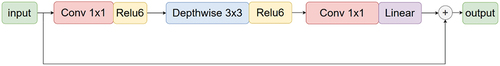
Figure 7. Residual convolution unit (RCU)(left) and fusion block(right).
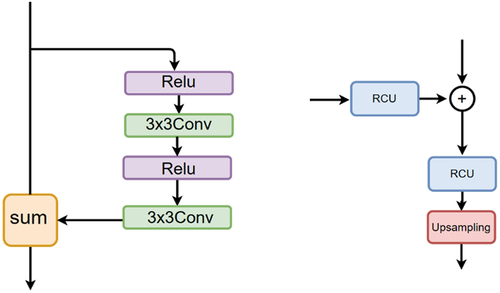
Figure 8. (a) Input RGB image (b) Relative depth map predicted by Monodepth2 (c) Metric depth map predicted by MobileDepth.
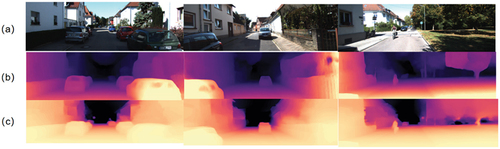
Figure 9. Qualitative comparison with ground truth.
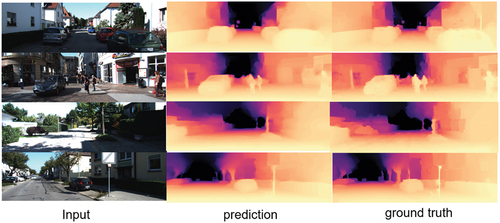
Table 2. Quantitative results. Compare our method to existing methods on KITTI.
Table 3. Quantitative results. Compare our method to existing methods on NYU.
Table 4. Comparison of MobileDepth with existing models in parameters.
Table 5. Complexity of models.
Table 6. Ablation study for components and loss function.
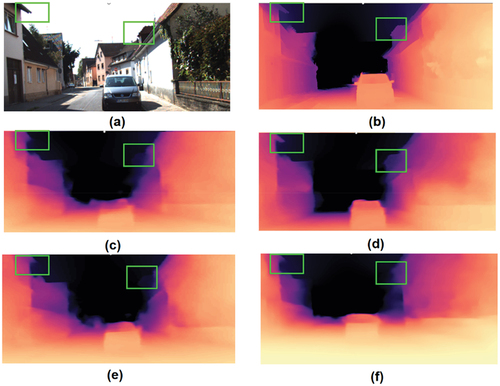
Figure 10. Quantitative ablation comparison experiments. (a) The input image. (b) The ground truth. (c) The predicted depth map using MSE loss function. (d)The predicted depth map via full model. (e) The predicted depth map without DSAB block. (f) The predicted depth map without MV2 block.