
Figures & data
Figure 1. Logistic chaotic mapping distribution.
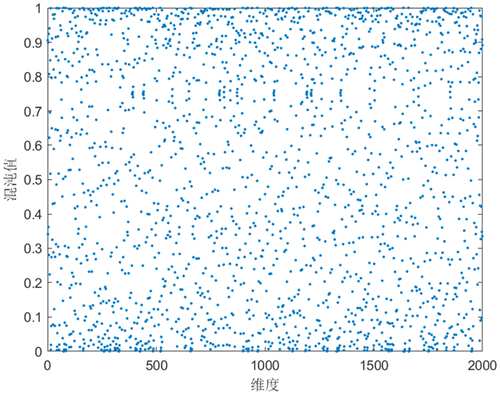
Figure 2. Schematic diagram of Levy’s flight.
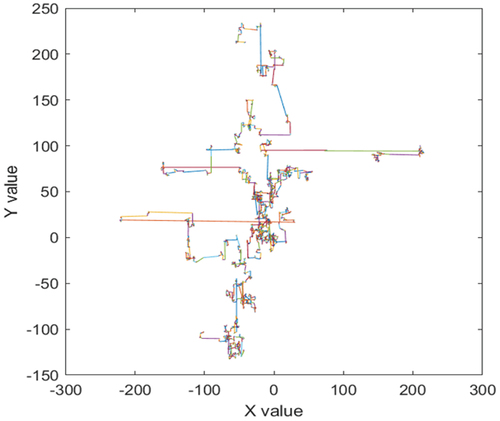
Figure 3. Flow chart of improved LPOA.
Figure 4. The parameter space diagram of the benchmark function.
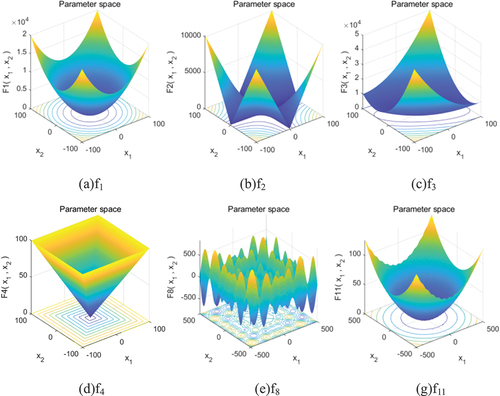
Table 1. Details of the benchmark functions.
Figure 5. Algorithm comparison iteration diagram.
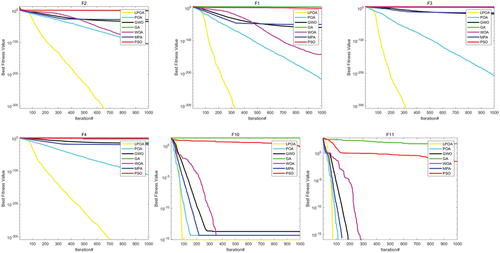
Table 2. Comparison of the performance of the algorithms in the benchmark function.
Table 3. Order by Friedman test in dimensions D = 30.
Figure 6. Simulation result graph.
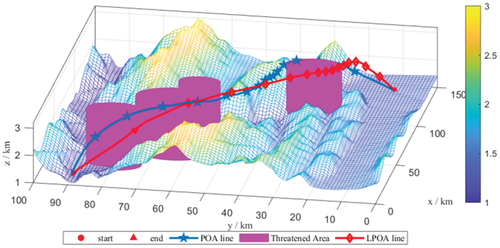
Figure 7. Comparison of algorithm iterations.
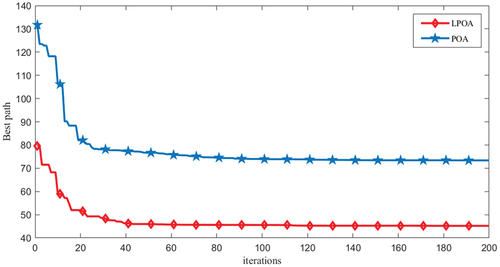
Table 4. Partial parameters of the algorithm.
Table 5. Statistics of experimental results.
Data Availability Statement
The data used to support the findings of this study are included within the article.