
Figures & data
Figure 1. Overall architecture of the proposed method.
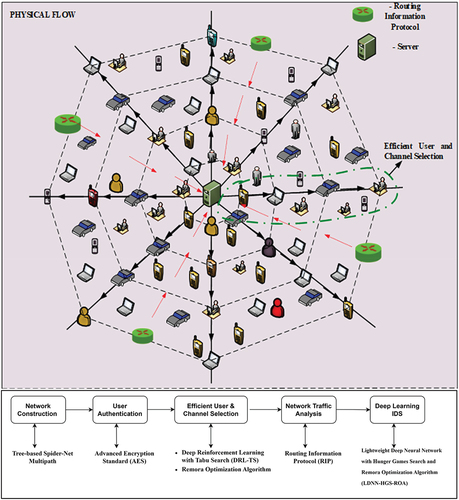
Figure 2. Tree-based Spider-Net multipath.
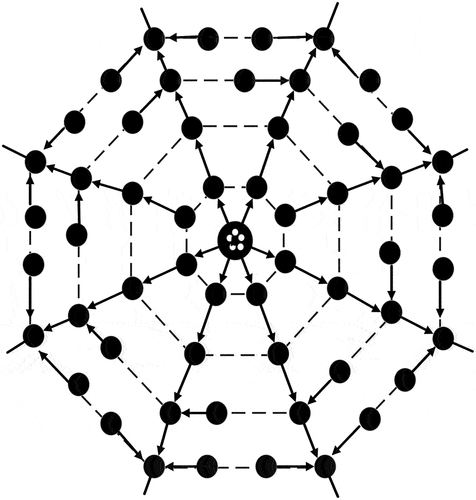
Figure 3. Network traffic identification process based on DPI.
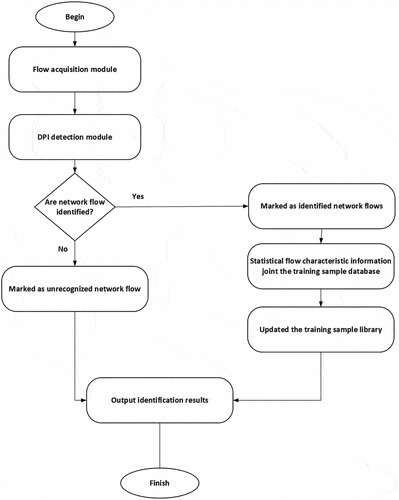
Figure 4. Deep packet inspection with AES.
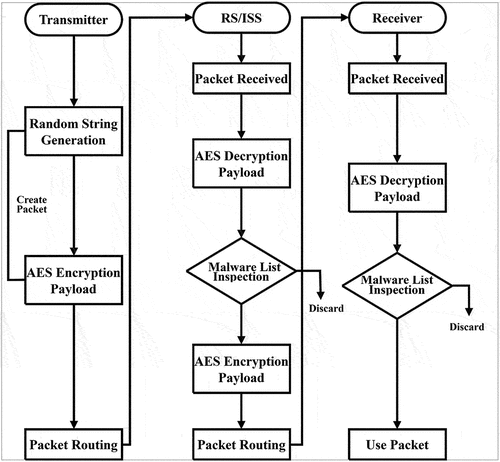
Figure 5a. Deep reinforcement learning.
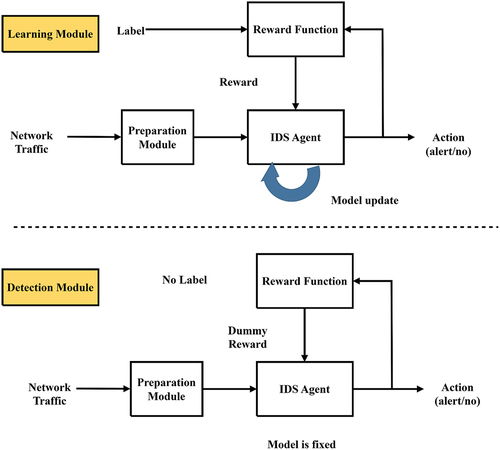
Table 1. Tabu search algorithm parameters.
Table
Table
Figure 5b. Standard convolution.
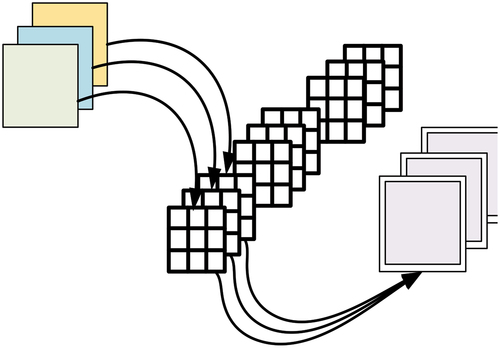
Figure 5c. Depth-wise convolution.
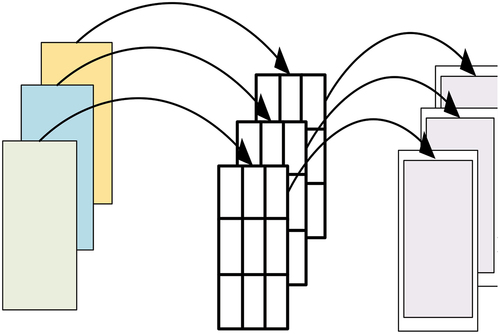
Figure 6. Lightweight unit B architecture.
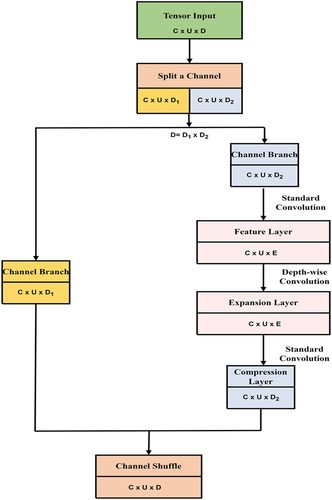
Figure 7. Channel shuffle.
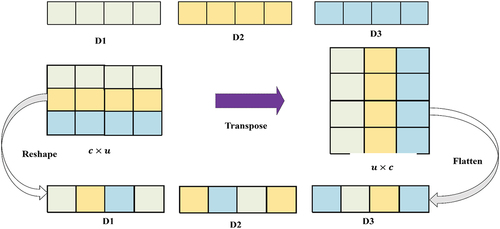
Figure 8. Fitness value of HGS-ROA.
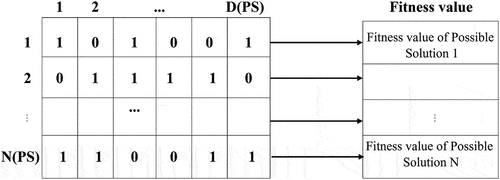
Figure 9. Number of users vs authentication rate (bytes).
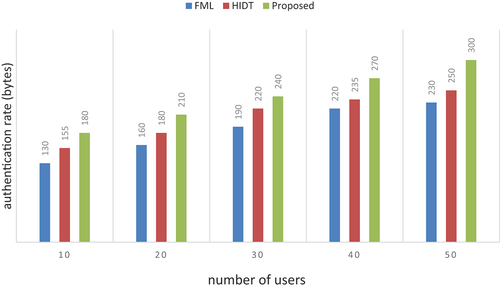
Table 2. Numerical outcomes of authentication rate.
Figure 10. Number of IOT devices vs accuracy (%).
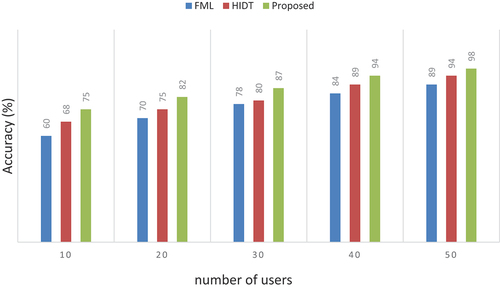
Table 3. Numerical outcomes of accuracy.
Figure 11. Number of IOT devices vs precision (%).
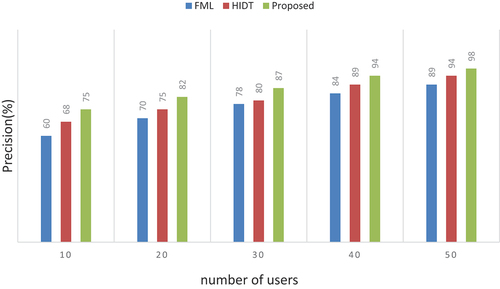
Table 4. Numerical outcomes of precision.
Figure 12. Number of IOT devices vs throughput (kbps).
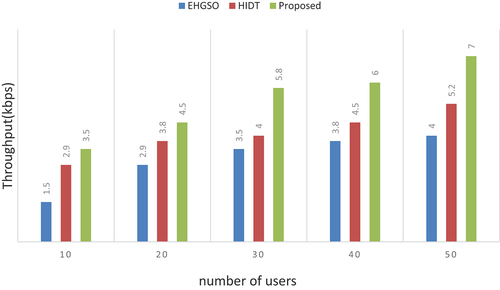
Table 5. Numerical outcomes of throughput.
Figure 13. Number of IOT devices vs packet delivery ratio (%).
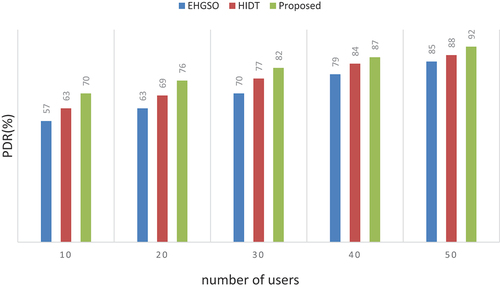
Table 6. Numerical outcomes of packet delivery ratio.
Figure 14. Number of IOT devices vs attack detection rate (%).
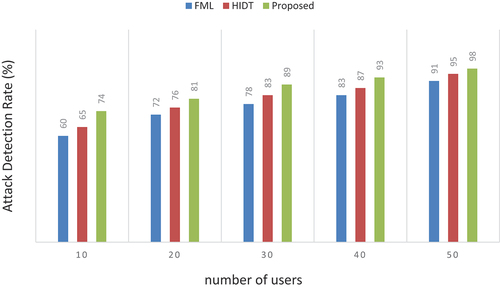
Table 7. Numerical outcomes of attack detection rate.
Figure 15. Number of IOT devices vs delay (sec).
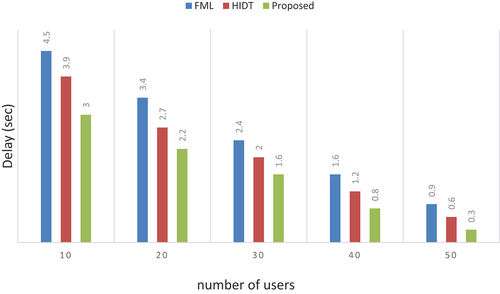
Table 8. Numerical outcomes of delay.
Figure 16. Number of IOT devices vs recall (%).
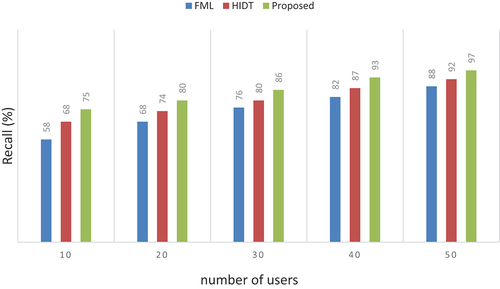
Table 9. Numerical outcomes of recall.
Figure 17. Number of IOT devices vs F1-score (%).
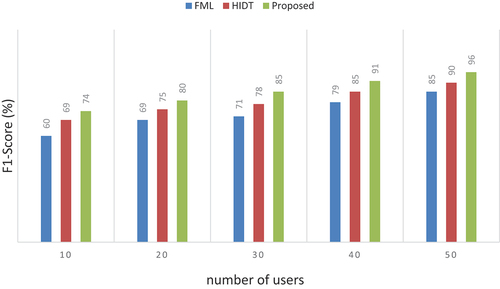
Table 10. Numerical outcomes of F1-score.