
Figures & data
Table 1. Characteristics help fake news identification.
Table 2. Example of COVID fake news about virus, vaccine and treatment topics.
Figure 1. Analytics process of the proposed fake news discriminative model.
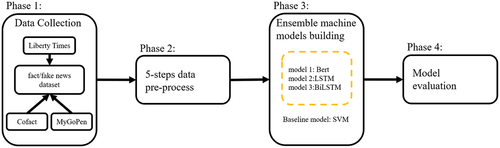
Table 3. Source dataset of fake news from MyGoPen, cofact and liberty times.
Figure 2. Five steps in data pre-process of phase 2.
Figure 3. Displays word clouds demonstrating the difference between real (left) and fake (right) news.
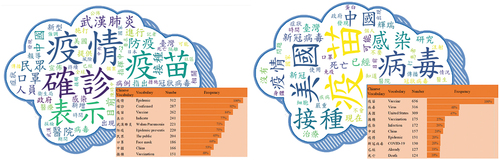
Figure 4. Architecture of a news article, showing decomposition into three features: headline, body, and tail. (in , an example news article is decomposed in blue.).
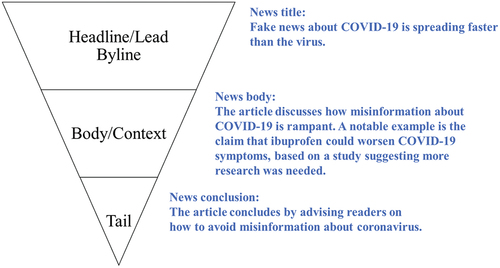
Figure 5. Experiment results of ROC curve of study 1 (blue line is SVM, red line is LSTM, gray line is bilstm, yellow Bert Model).
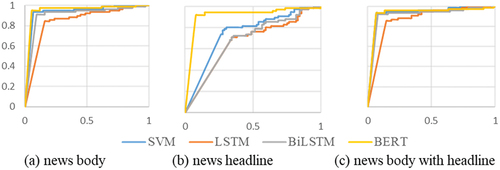
Table 4. The experiment comparisons among classifiers.
Table 5. The experiment results of discriminant effect for fake news among news architectures.
Figure 6. The sentiment score of real and fake new of the dataset.
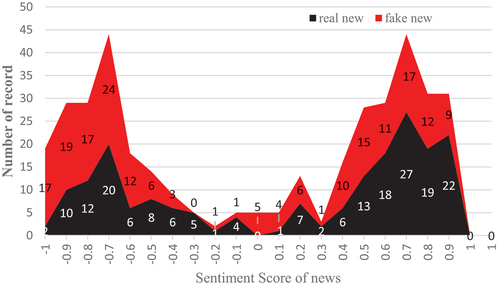
Table 6. The experiment results of sentiment analysis for discriminant effect improvement of fake news detection.
Figure 7. Experiment results of ROC curve of study 2.
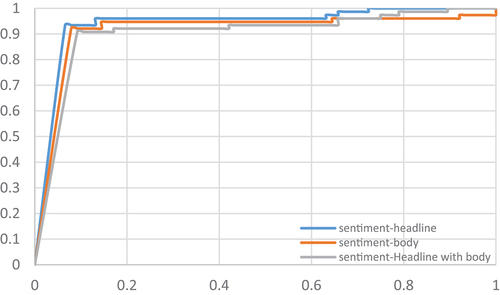
Figure 8. The sentiment count of real and fake news.
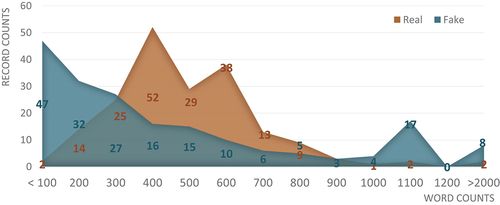
Figure 9. Experiment results of ROC curve of study 3(The blue line is writing style and the orange line is writing style with sentiment score).
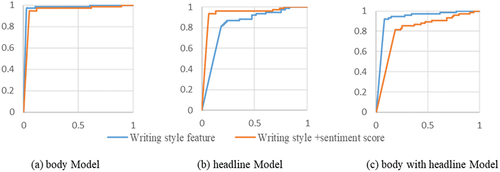
Table 7. The experiment results of discriminant effect for fake news among news architectures.
Table 8. Summary interpretability and explainability of experimental results.
Table 9. Studies on zero-shot fake news detection with LLMs.
Data Availability Statement
The data underlying this article will be shared on reasonable request to the corresponding author.