
Figures & data
Figure 1. The influence of students and marketing-related experts in determining L&T website information (based on Hosein & Rao, Citation2015; NUS, Citation2012; QAA, Citation2013a; QAA, Citation2013b; QAA, Citation2013c; Rao & Hosein, Citation2017).
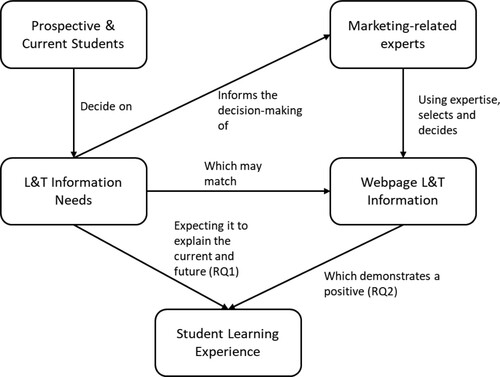
Figure 2. Availability of L&T Information and Student Satisfaction Mediation Model.
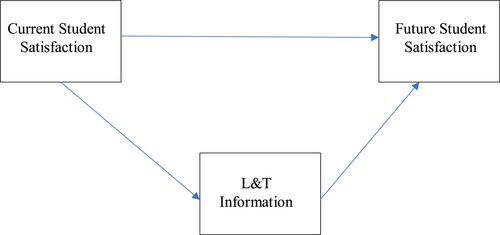
Table 1. The seven included QAA L&T variables, description and their presence across 38 HEIs (adapted from Hosein & Rao, Citation2015).
Table 2. Standardised Total Effects of the Availability of L&T Information and Student Satisfaction Model across 36 HEIs.
Table A1. The eight excluded variables, description and their presence across the original 38 HEIs (from Hosein & Rao, Citation2015).
Table A2. Correlations between the 7 L&T variables for the 36 HEIs.
Table A3. Correlations between the 7 L&T variables and the 2015 and 2019 NSS for the 36 HEIs.
Table A4. Correlations between the 2015 and 2019 NSS variables for 313 HEIs.