Figures & data
Figure 1. Predicted path model of the effects of trust-building interview tactics.
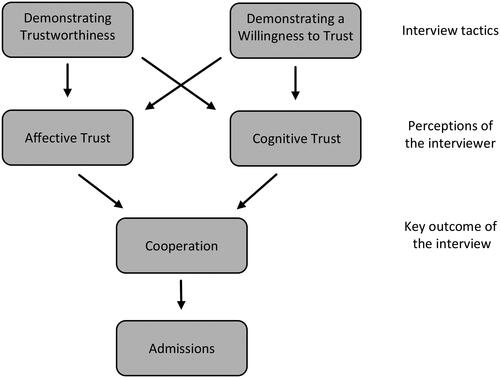
Table 1. An Overview of the Main Psychological Constructs and Items Used.
Figure 2. Observed path model illustrating effects sizes of the direct effects of trust-building interview tactics. *p < .05; **p < .01; ***p < .001.
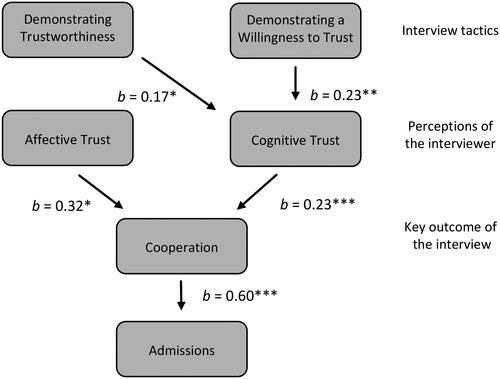
Figure 3. Observed path model illustrating effects sizes of the direct effects of trust-building interview tactics. *p < .05; **p = .01.
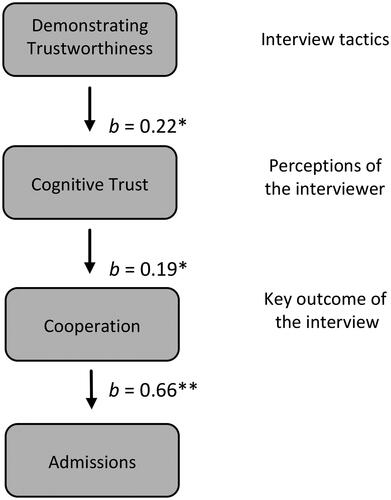
Figure 4. Observed path model illustrating effects sizes of the direct effects of trust-building interview tactics. ^p = .06; *p = .05; **p < .01; ***p < .001.
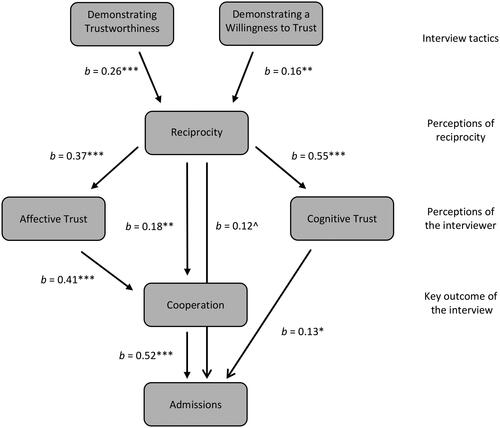
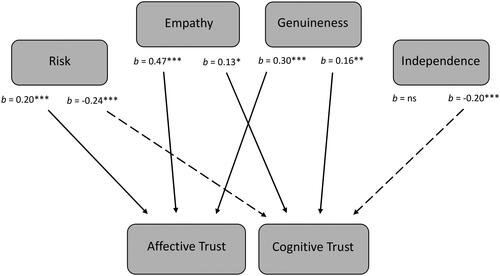
Figure 5. Observed path model illustrating effects sizes of the direct effects of trust facilitating elements on affective and cognitive trust. Dashed lines denote negative relationships. *p < .05; **p < .01; ***p < .001.