584
Views
5
CrossRef citations to date
0
Altmetric
Clinical Study

The Relationship between the VEGF Levels and VEGF mRNA Expression and Clinical Course in Different Glomerulonephritis

, , , &
Pages 779-784 | Published online: 07 Jul 2009

Figures & data

Table 1 The diagnosis of renal biopsy

Table 2 Demographic and biochemical findings at baseline and 3, 6, and 12 months

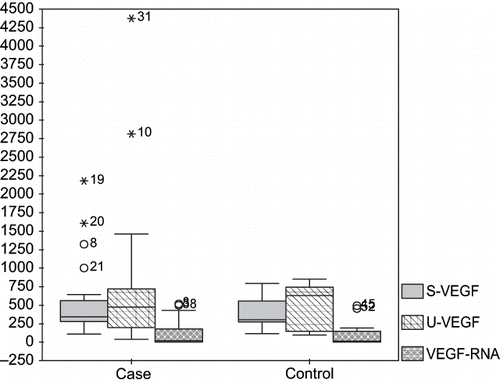
Figure 1. PBMNC VEGF mRNA expression and serum/urine VEGF levels in patients and controls.

Figure 1. PBMNC VEGF mRNA expression and serum/urine VEGF levels in patients and controls.

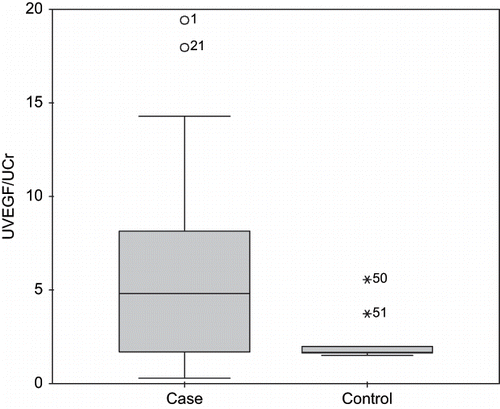
Figure 2. The ratio of urine VEGF/urine creatinine levels in patients and controls.

Figure 2. The ratio of urine VEGF/urine creatinine levels in patients and controls.

Table 3 PBMNC VEGF mRNA expression and serum/urine VEGF levels in patients and controls

Table 4 Baseline and serial serum and urine VEGF and PBMNC mRNA levels in six of the patients whose proteinuria disappeared in follow-up period

Table 5 The serum and urine VEGF levels and PBMNC mRNA expression according to the glomerular sclerosis, tubulointerstitial nephritis (TIF), periglomerular fibrosis, and mesangial cell proliferation
Reprints and Corporate Permissions

Please note: Selecting permissions does not provide access to the full text of the article, please see our help page How do I view content?

To request a reprint or corporate permissions for this article, please click on the relevant link below:

Academic Permissions

Please note: Selecting permissions does not provide access to the full text of the article, please see our help page How do I view content?

Obtain permissions instantly via Rightslink by clicking on the button below:

If you are unable to obtain permissions via Rightslink, please complete and submit this Permissions form. For more information, please visit our Permissions help page.