2,836
Views
77
CrossRef citations to date
0
Altmetric
Laboratory Study

Antihyperlipidemic Effect of Curcumin and Tetrahydrocurcumin in Experimental Type 2 Diabetic Rats

&
Pages 881-889 | Published online: 07 Jul 2009

Figures & data

Figure 1. Chemical structures of curcumin and its major metabolite, tetrahydrocurcumin (THC). Curcumin and THC have similar β-diketone structures and phenolic groups.
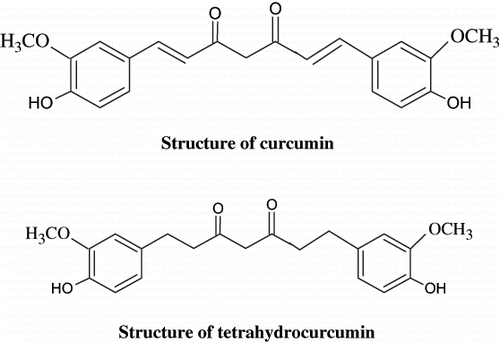
Figure 1. Chemical structures of curcumin and its major metabolite, tetrahydrocurcumin (THC). Curcumin and THC have similar β-diketone structures and phenolic groups.

Figure 2. Influence of curcumin and THC on the levels of blood glucose and plasma insulin in control and experimental rats. Values are given as mean ± S.D for six rats in each group. Values not sharing a common superscript letter differ significantly at p < 0.05 (DMRT).
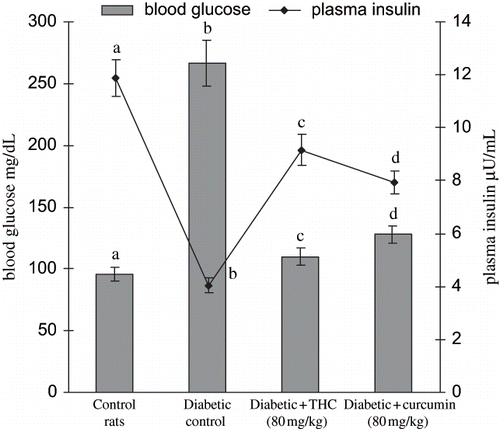
Figure 2. Influence of curcumin and THC on the levels of blood glucose and plasma insulin in control and experimental rats. Values are given as mean ± S.D for six rats in each group. Values not sharing a common superscript letter differ significantly at p < 0.05 (DMRT).
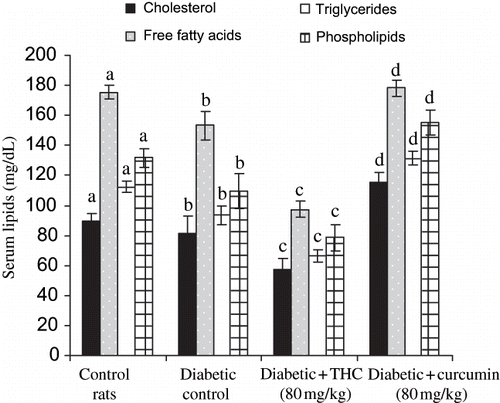
Figure 3. Influence of THC and curcumin on serum cholesterol, triglycerides, free fatty acids, and phospholipids in control and experimental rats. Values are given as mean ± S.D for six rats in each group. Values not sharing a common superscript letter differ significantly at p < 0.05 (DMRT).
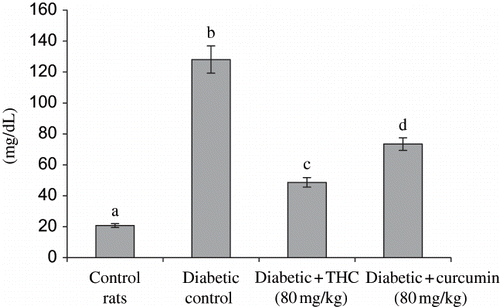
Figure 3. Influence of THC and curcumin on serum cholesterol, triglycerides, free fatty acids, and phospholipids in control and experimental rats. Values are given as mean ± S.D for six rats in each group. Values not sharing a common superscript letter differ significantly at p < 0.05 (DMRT).
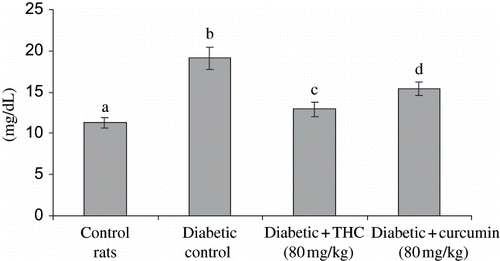
Figure 4. Influence of THC and curcumin on the levels of LDL cholesterol in control and experimental rats. Values are given as mean ± S.D for six rats in each group. Values not sharing a common superscript letter differ significantly at p < 0.05 (DMRT).
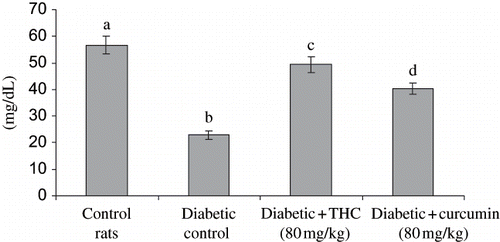
Figure 4. Influence of THC and curcumin on the levels of LDL cholesterol in control and experimental rats. Values are given as mean ± S.D for six rats in each group. Values not sharing a common superscript letter differ significantly at p < 0.05 (DMRT).
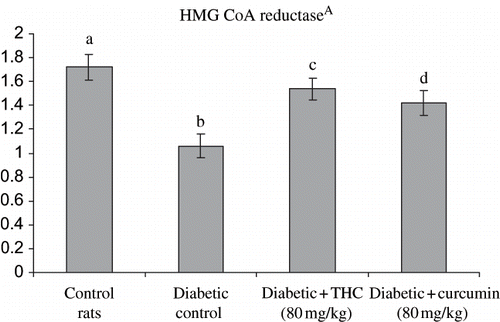
Figure 5. Influence of THC and curcumin on the levels of VLDL cholesterol in control and experimental rats. Values are given as mean ± S.D for six rats in each group. Values not sharing a common superscript letter differ significantly at p < 0.05 (DMRT).

Figure 5. Influence of THC and curcumin on the levels of VLDL cholesterol in control and experimental rats. Values are given as mean ± S.D for six rats in each group. Values not sharing a common superscript letter differ significantly at p < 0.05 (DMRT).

Figure 6. Influence of THC and curcumin on HDL cholesterol levels of control and experimental rats. Values are given as mean ± S.D for six rats in each group. Values not sharing a common superscript letter differ significantly at p < 0.05 (DMRT).

Figure 6. Influence of THC and curcumin on HDL cholesterol levels of control and experimental rats. Values are given as mean ± S.D for six rats in each group. Values not sharing a common superscript letter differ significantly at p < 0.05 (DMRT).

Figure 7. Influence of THC and curcumin on hepatic HMG COA reductase levels of control and experimental rats. A: HMG CoA / Mevalonate ratio. Values are given as mean ± S.D for six rats in each group. Values not sharing a common superscript letter differ significantly at p < 0.05 (DMRT).

Figure 7. Influence of THC and curcumin on hepatic HMG COA reductase levels of control and experimental rats. A: HMG CoA / Mevalonate ratio. Values are given as mean ± S.D for six rats in each group. Values not sharing a common superscript letter differ significantly at p < 0.05 (DMRT).

Figure 8. Influence of THC and curcumin on liver cholesterol, free fatty acids, and triglycerides levels of control and experimental rats. Values are given as mean ± S.D for six rats in each group.
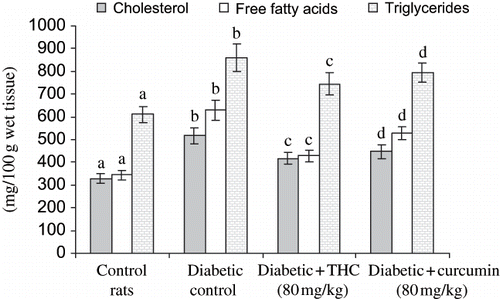
Figure 8. Influence of THC and curcumin on liver cholesterol, free fatty acids, and triglycerides levels of control and experimental rats. Values are given as mean ± S.D for six rats in each group.

Figure 9. Influence of THC and curcumin liver phospholipids levels of control and experimental rats. Values are given as mean ± S.D for six rats in each group. Values not sharing a common superscript letter differ significantly at p < 0.05 (DMRT).
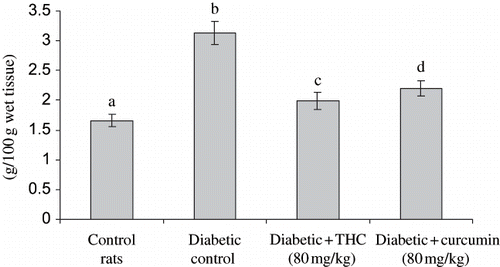
Figure 9. Influence of THC and curcumin liver phospholipids levels of control and experimental rats. Values are given as mean ± S.D for six rats in each group. Values not sharing a common superscript letter differ significantly at p < 0.05 (DMRT).

Figure 10. Figure A: Control rat liver: H&E × 20; normal architecture of liver. Figure B: Diabetic treated rat liver: H&E × 20; inflammatory infiltration filling over the sinusoidal vacuolation of hepatocytic nuclei. Figure C: Diabetic treated rat liver: H&E × 20; portal triad with mild inflammation and cell infiltration. Figure D: Diabetic + THC treated rat liver: H&E × 20; near normal appearance of hepatocytes. Figure E: Diabetic + curcumin treated rat liver: H&E × 20; near normal appearance with mild changes in hepatocytes.
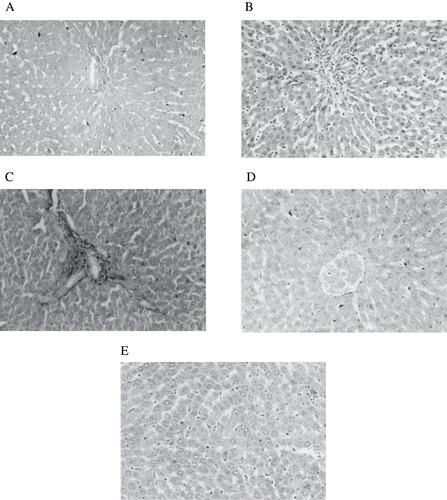
Figure 10. Figure A: Control rat liver: H&E × 20; normal architecture of liver. Figure B: Diabetic treated rat liver: H&E × 20; inflammatory infiltration filling over the sinusoidal vacuolation of hepatocytic nuclei. Figure C: Diabetic treated rat liver: H&E × 20; portal triad with mild inflammation and cell infiltration. Figure D: Diabetic + THC treated rat liver: H&E × 20; near normal appearance of hepatocytes. Figure E: Diabetic + curcumin treated rat liver: H&E × 20; near normal appearance with mild changes in hepatocytes.

Reprints and Corporate Permissions

Please note: Selecting permissions does not provide access to the full text of the article, please see our help page How do I view content?

To request a reprint or corporate permissions for this article, please click on the relevant link below:

Academic Permissions

Please note: Selecting permissions does not provide access to the full text of the article, please see our help page How do I view content?

Obtain permissions instantly via Rightslink by clicking on the button below:

If you are unable to obtain permissions via Rightslink, please complete and submit this Permissions form. For more information, please visit our Permissions help page.