443
Views
17
CrossRef citations to date
0
Altmetric
Laboratory Study

Ras Activation Modulates Methylglyoxal-Induced Mesangial Cell Apoptosis Through Superoxide Production

, , , , , , , & show all
Pages 911-921 | Published online: 07 Jul 2009

Figures & data

Figure 1. (A) Effect of various MGO concentrations (10 μM, 50 μM, 100 μM, 200 μM) on the viability of rat renal mesangial cells. (B) MGO increased caspase-3 activation of mesangial cells. (C) Inhibition of superoxide by SOD or DPI, suppression of P38 activity by SB203580, and inhibition of Ras activity manumycin A rescued the promoting effect of MGO on cleaved caspase 3 protein expression. Total extract of cell cultures were subjected to Western blot assays. The relative intensities of the immunoblotting bands were measured by densitometry normalized to each vehicle. Experimental results are presented as means ± standard errors calculated from three triplicate experiments.
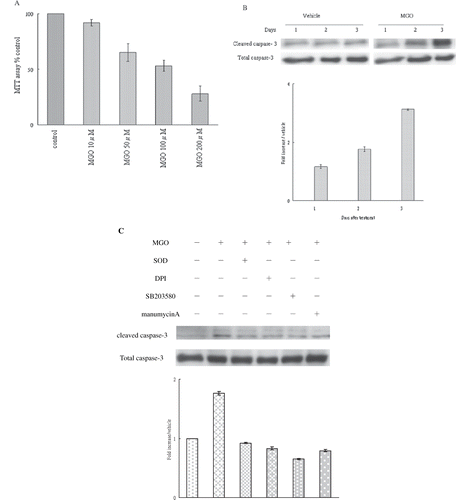
Figure 1. (A) Effect of various MGO concentrations (10 μM, 50 μM, 100 μM, 200 μM) on the viability of rat renal mesangial cells. (B) MGO increased caspase-3 activation of mesangial cells. (C) Inhibition of superoxide by SOD or DPI, suppression of P38 activity by SB203580, and inhibition of Ras activity manumycin A rescued the promoting effect of MGO on cleaved caspase 3 protein expression. Total extract of cell cultures were subjected to Western blot assays. The relative intensities of the immunoblotting bands were measured by densitometry normalized to each vehicle. Experimental results are presented as means ± standard errors calculated from three triplicate experiments.

Figure 2. (A) MGO increased superoxide synthesis by mesangial cells in 2 hours to 24 hours. (B) Inhibition of superoxide by DPI and manumycin A, but not by rotenone, allopurinol, or SB203580, reduced MGO augmented superoxide production at 6 hour. Results are presented with mean values ± standard errors calculated from six paired triplicate experiments. * and # respectively show the difference from vehicle and MGO group, p < 0.05.
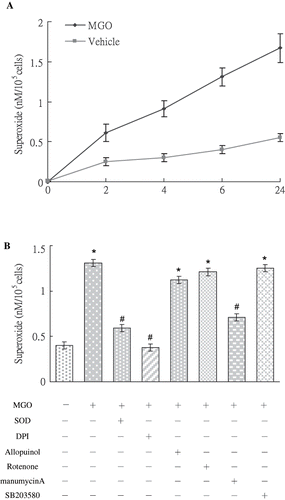
Figure 2. (A) MGO increased superoxide synthesis by mesangial cells in 2 hours to 24 hours. (B) Inhibition of superoxide by DPI and manumycin A, but not by rotenone, allopurinol, or SB203580, reduced MGO augmented superoxide production at 6 hour. Results are presented with mean values ± standard errors calculated from six paired triplicate experiments. * and # respectively show the difference from vehicle and MGO group, p < 0.05.

Figure 3. (A) MGO rapidly increased Ras activation in rat renal mesangial cells. (B) Inhibition of Ras activity by manumycin A but not inhibition of superoxide by SOD reduced the promoting effect of high MGO on Ras activation at 1 hour. Cell cultures (1 × 10⁶ cells/dish, 100mm culture dish) were pretreated with 2.5μM manumycin A and subjected to high MGO treatment. The relative intensities of the immunoblotting bands were measured by densitometry normalized to each vehicle. Experimental results are presented as means ± standard errors calculated from three triplicate experiments.
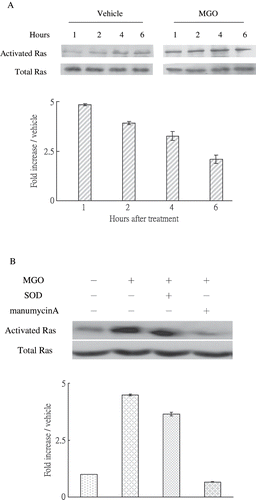
Figure 3. (A) MGO rapidly increased Ras activation in rat renal mesangial cells. (B) Inhibition of Ras activity by manumycin A but not inhibition of superoxide by SOD reduced the promoting effect of high MGO on Ras activation at 1 hour. Cell cultures (1 × 10⁶ cells/dish, 100mm culture dish) were pretreated with 2.5μM manumycin A and subjected to high MGO treatment. The relative intensities of the immunoblotting bands were measured by densitometry normalized to each vehicle. Experimental results are presented as means ± standard errors calculated from three triplicate experiments.
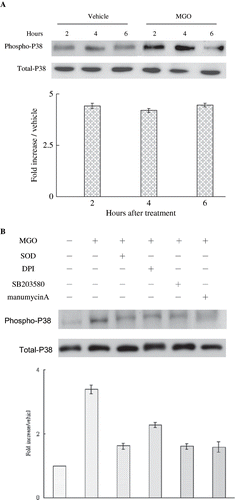
Figure 4. (A) High MGO increased cytosolic P38 activation. (B) Inhibition of superoxide by SOD or DPI or suppression of P38 activity by SB203580 and inhibition of Ras activity by manumycin A reduced the promoting effect of MGO on cytosolic P38 activation in four hours. Cytosolic fractions of cell lysate from cultures were subjected to Western blot assay. Immunoblotting of P38 showed equal loadings and transfer for all lanes. The relative intensities of the immunoblotting bands were measured by densitometry normalized to each vehicle. Experimental results are presented as means ± standard errors calculated from three triplicate experiments.
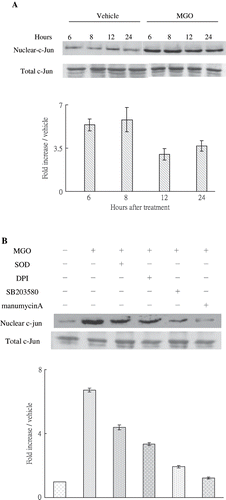
Figure 4. (A) High MGO increased cytosolic P38 activation. (B) Inhibition of superoxide by SOD or DPI or suppression of P38 activity by SB203580 and inhibition of Ras activity by manumycin A reduced the promoting effect of MGO on cytosolic P38 activation in four hours. Cytosolic fractions of cell lysate from cultures were subjected to Western blot assay. Immunoblotting of P38 showed equal loadings and transfer for all lanes. The relative intensities of the immunoblotting bands were measured by densitometry normalized to each vehicle. Experimental results are presented as means ± standard errors calculated from three triplicate experiments.

Figure 5. (A) MGO-induced nuclear c-Jun activation. Inhibition of superoxide by SOD or DPI, suppression of P38 activity by SB203580, and inhibiting Ras activity by manumycin A reduced the promoting effect of MGO on nuclear c-Jun activation. Cytosolic and nuclear fractions of cell lysate from cultures were subjected to Western blot assay. Immunoblotting of total c-Jun showed equal loadings and transfer for all lanes. The relative intensities of the immunoblotting bands were measured by densitometry normalized to each vehicle. Experimental results are presented as means ± standard errors calculated from three triplicate experiments.

Figure 5. (A) MGO-induced nuclear c-Jun activation. Inhibition of superoxide by SOD or DPI, suppression of P38 activity by SB203580, and inhibiting Ras activity by manumycin A reduced the promoting effect of MGO on nuclear c-Jun activation. Cytosolic and nuclear fractions of cell lysate from cultures were subjected to Western blot assay. Immunoblotting of total c-Jun showed equal loadings and transfer for all lanes. The relative intensities of the immunoblotting bands were measured by densitometry normalized to each vehicle. Experimental results are presented as means ± standard errors calculated from three triplicate experiments.

Figure 6. The profile in vehicle group (A) and the percentage of cells undergoing apoptosis (annexin V-positive, lower panel) under various conditions (B) were shown. Role of NADPH oxidase, P38 MAP kinase, and Ras signaling pathways was in MGO-induced mesangial cell apoptosis. SOD, DPI, SB203580, and manumycinA significantly reduced the percentage of apoptosis. The results shown represent the means ± SD of three experiments. * and # respectively show the difference from the vehicle and MGO group, p < 0.05.
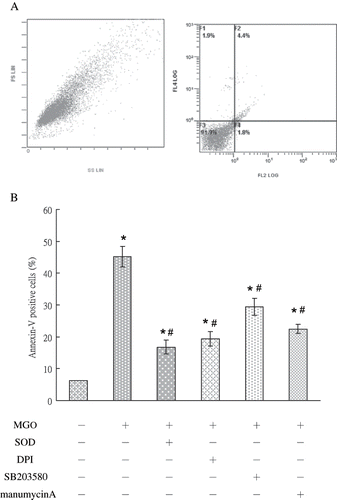
Figure 6. The profile in vehicle group (A) and the percentage of cells undergoing apoptosis (annexin V-positive, lower panel) under various conditions (B) were shown. Role of NADPH oxidase, P38 MAP kinase, and Ras signaling pathways was in MGO-induced mesangial cell apoptosis. SOD, DPI, SB203580, and manumycinA significantly reduced the percentage of apoptosis. The results shown represent the means ± SD of three experiments. * and # respectively show the difference from the vehicle and MGO group, p < 0.05.

Figure 7. TUNEL staining photography of MGO-treated RMC with or without various treatments, including SOD, DPI, SB203580, and manumycin A. In comparison with the control group, mesangial cells in MGO treatment expressed strong TUNEL immunostaining. Decreased TUNEL staining was observed after pretreatment with SOD, DPI, SB203580, and manumycin A, individually. Specimens were observed in magnification = 200×.
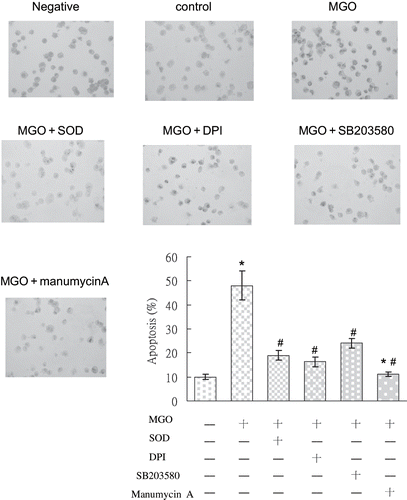
Figure 7. TUNEL staining photography of MGO-treated RMC with or without various treatments, including SOD, DPI, SB203580, and manumycin A. In comparison with the control group, mesangial cells in MGO treatment expressed strong TUNEL immunostaining. Decreased TUNEL staining was observed after pretreatment with SOD, DPI, SB203580, and manumycin A, individually. Specimens were observed in magnification = 200×.

Reprints and Corporate Permissions

Please note: Selecting permissions does not provide access to the full text of the article, please see our help page How do I view content?

To request a reprint or corporate permissions for this article, please click on the relevant link below:

Academic Permissions

Please note: Selecting permissions does not provide access to the full text of the article, please see our help page How do I view content?

Obtain permissions instantly via Rightslink by clicking on the button below:

If you are unable to obtain permissions via Rightslink, please complete and submit this Permissions form. For more information, please visit our Permissions help page.