Figures & data
Table 1 Characteristics of the peritoneal dialysis patients
Figure 1. Relationship between ankle-brachial index (ABI) and toe-brachial index (TBI) in peritoneal dialysis patients.
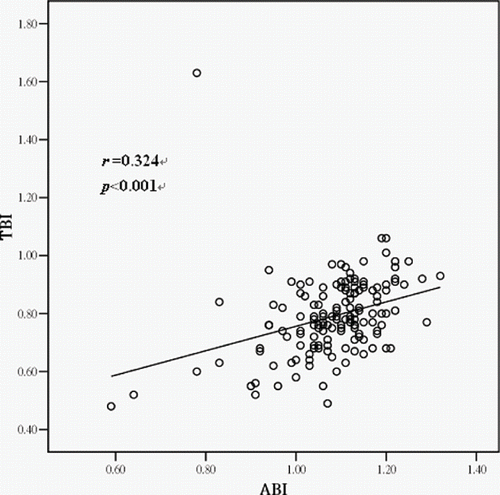
Table 2 Correlation coefficients between ABI/TBI and other variables
Table 3 Results of step-wise multiple regression analysis to assess the correlation of ABI or TBI with other variables
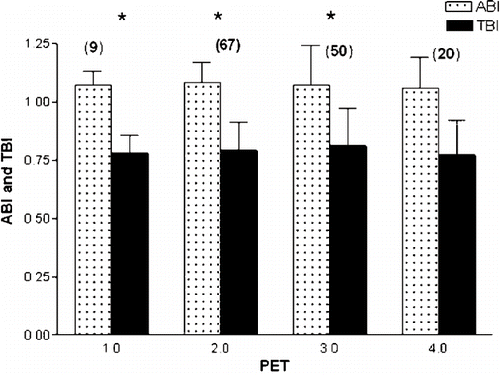
Figure 2. No significant difference of ankle-brachial index (ABI) and toe-brachial index (TBI) in patients with different peritoneal equilibration test (PET) category: 1 = low, 2 = low average, 3 = high average, 4 = high. *p > 0.05 vs. group 4. The number in parentheses indicates the number of patients in each group.