477
Views
14
CrossRef citations to date
0
Altmetric
Laboratory Study

Poly (ADP-Ribose) Polymerase as a Potential Target for the Treatment of Acute Renal Injury Caused by Lipopolysaccharide

, , &
Pages 115-120 | Published online: 07 Jul 2009

Figures & data

Figure 1. Effect of PJ34 on plasma BUN levels after LPS administration. BUN levels were measured 8 hr after treatment with saline, PJ34, or LPS. All values are expresses as mean ± SEM, n = 7–8. *p < 0.05 as compared with control.
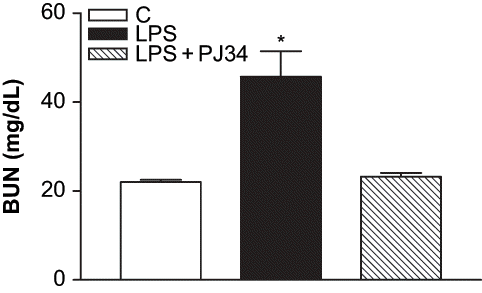
Figure 1. Effect of PJ34 on plasma BUN levels after LPS administration. BUN levels were measured 8 hr after treatment with saline, PJ34, or LPS. All values are expresses as mean ± SEM, n = 7–8. *p < 0.05 as compared with control.
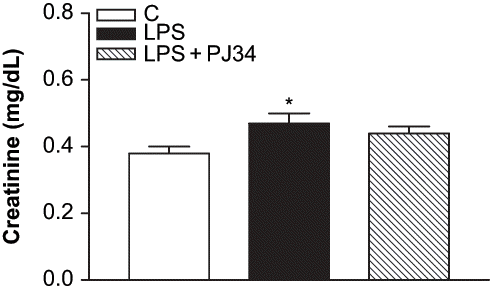
Figure 2. Effect of PJ34 on plasma creatinine levels after LPS administration. BUN levels were measured 8 hr after treatment with saline, PJ34, or LPS. All values are expresses as mean ± SEM, n = 7–8. *p < 0.05 as compared with control.

Figure 2. Effect of PJ34 on plasma creatinine levels after LPS administration. BUN levels were measured 8 hr after treatment with saline, PJ34, or LPS. All values are expresses as mean ± SEM, n = 7–8. *p < 0.05 as compared with control.

Figure 3. Effect of PJ34 on urinary NAG levels after LPS administration. All values are expresses as mean ± SEM, n = 4. *p < 0.05 as compared with control.
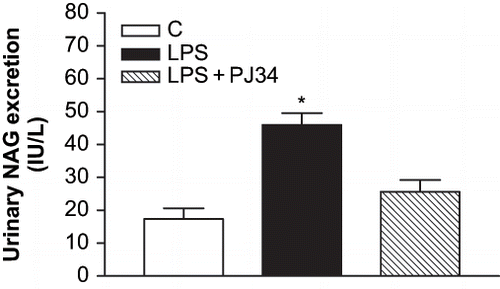
Figure 3. Effect of PJ34 on urinary NAG levels after LPS administration. All values are expresses as mean ± SEM, n = 4. *p < 0.05 as compared with control.
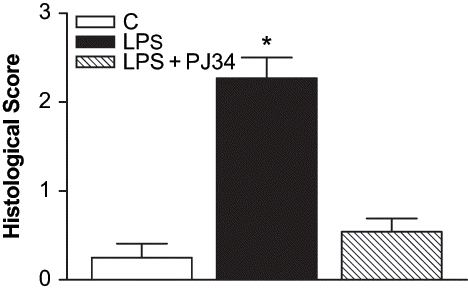
Figure 4. Histopathological evaluation of renal sections: (a) control kidneys; (b) LPS-treated kidneys; (c) improvement of renal histology in PJ34-treated rats (hematoxylin and eosin; original magnification × 200).

Figure 4. Histopathological evaluation of renal sections: (a) control kidneys; (b) LPS-treated kidneys; (c) improvement of renal histology in PJ34-treated rats (hematoxylin and eosin; original magnification × 200).

Figure 5. Histopathological scores of renal sections. All values are expresses as mean ± SEM, n = 7–8. *p < 0.05 as compared with control.

Figure 5. Histopathological scores of renal sections. All values are expresses as mean ± SEM, n = 7–8. *p < 0.05 as compared with control.

Reprints and Corporate Permissions

Please note: Selecting permissions does not provide access to the full text of the article, please see our help page How do I view content?

To request a reprint or corporate permissions for this article, please click on the relevant link below:

Academic Permissions

Please note: Selecting permissions does not provide access to the full text of the article, please see our help page How do I view content?

Obtain permissions instantly via Rightslink by clicking on the button below:

If you are unable to obtain permissions via Rightslink, please complete and submit this Permissions form. For more information, please visit our Permissions help page.