858
Views
16
CrossRef citations to date
0
Altmetric
Laboratory Studies

Polyphenolic Extract of Ichnocarpus Frutescens Attenuates Diabetic Complications in Streptozotocin-Treated Diabetic Rats

&
Pages 307-322 | Published online: 07 Jul 2009

Figures & data

Table 1 Aldose reductase inhibitory activity of polyphenolic extract of I. frutescens on rat isolated lens enzyme

Figure 1. Effect of polyphenolic extract on intrperitoneal tolerance text (IPGTT) on glucose (2 g/kg) loaded rats. Values are expressed mean SEM ± of six animals. *P < 0.05, **P < 0.001 compared with glucose loaded rats.
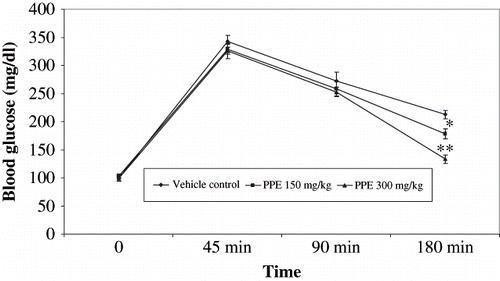
Figure 1. Effect of polyphenolic extract on intrperitoneal tolerance text (IPGTT) on glucose (2 g/kg) loaded rats. Values are expressed mean SEM ± of six animals. *P < 0.05, **P < 0.001 compared with glucose loaded rats.

Table 2 Effect of oral administration of polyphenolic extract (PPE) of I. frutescens on serum biochemical and urinary profiles of vehicle-treated and streptozotocin (STZ)-induced diabetic nephropathic rats after the eight-week treatment

Figure 2. Body weight (g) in polyphenolic extract (PPE) treated diabetic rats. Values are expressed as mean ± SEM (n = 6). * * P < 0.01 with respect to theire initial values.
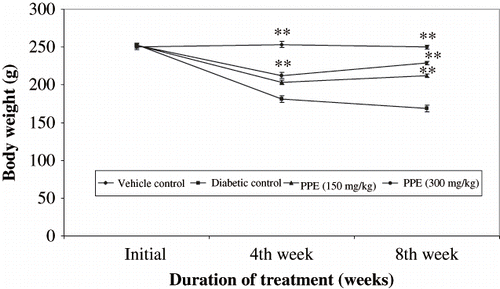
Figure 2. Body weight (g) in polyphenolic extract (PPE) treated diabetic rats. Values are expressed as mean ± SEM (n = 6). * * P < 0.01 with respect to theire initial values.

Figure 3. Effect of polyphenolic extract on blood glucose levels in normal and diabetic rats for 8 weeks. Data are mean of six rats for normal and experimental groups, respectively. **P < 0.01, *P < 0.05 compared with diabetic control of respective week.
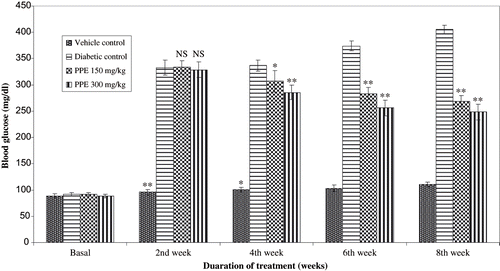
Figure 3. Effect of polyphenolic extract on blood glucose levels in normal and diabetic rats for 8 weeks. Data are mean of six rats for normal and experimental groups, respectively. **P < 0.01, *P < 0.05 compared with diabetic control of respective week.

Figure 4. Effect of polyphenolic extract (PPE) on renal antioxidant enzymes from normal and strptozotocin treated diabetic rats. Values are expressed as mean SEM of six animasl in each group. **P < 0.01 and *P < 0.05 compare with diabetic animals.
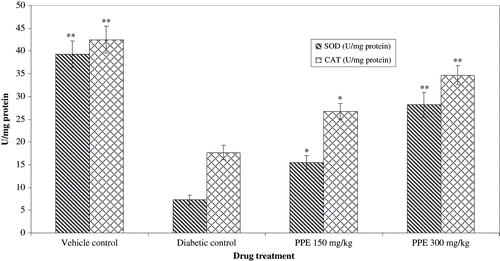
Figure 4. Effect of polyphenolic extract (PPE) on renal antioxidant enzymes from normal and strptozotocin treated diabetic rats. Values are expressed as mean SEM of six animasl in each group. **P < 0.01 and *P < 0.05 compare with diabetic animals.

Figure 5. Effect of polyphenolic extract (PPE) on reanl reduced glutethione (GSH) from normal and diabetic rats. Values are expressed as mean ± SEM of six animals each. **P < 0.01 compared with diabetic control.
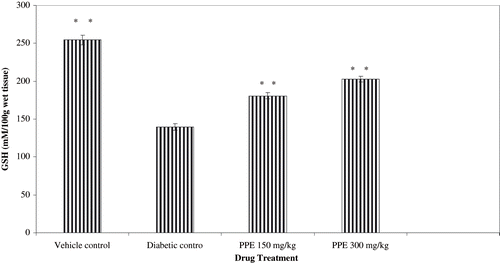
Figure 5. Effect of polyphenolic extract (PPE) on reanl reduced glutethione (GSH) from normal and diabetic rats. Values are expressed as mean ± SEM of six animals each. **P < 0.01 compared with diabetic control.

Figure 6. Effect of polyphenolic extract (PPE) on renal lipid peroxidation (LPO) from normal and diabetic rats. Values are expressed as mean ± SEM of six animals each. ** P < 0.01 compared with diabetic control.
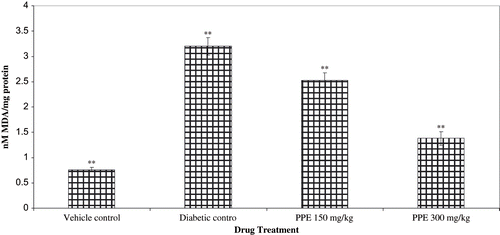
Figure 6. Effect of polyphenolic extract (PPE) on renal lipid peroxidation (LPO) from normal and diabetic rats. Values are expressed as mean ± SEM of six animals each. ** P < 0.01 compared with diabetic control.

Figure 7. Light microscopes of the glomeruli. Paraffin-impeded sections of the renal cortex were stained with hematoxylin. Representative light microscope (magnification ×200) from each of the rat groups are shown: (A) Normal glomerulus from non-diabetic rat at eight weeks; (B) glomerulus from untreated STZ diabetic rats at eight weeks showing hypertrophy; irregular, denued glomerular basement membrane, mesangial expansion; and global glomerulosclerosis; with the symptoms of early diabetic nephropathy symptoms; (C) glomerulus from rats treated with eight weeks of PPE, depicting partial reversal of glomerulosclerosis.
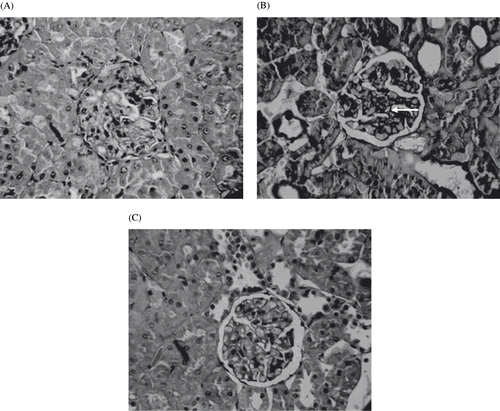
Figure 7. Light microscopes of the glomeruli. Paraffin-impeded sections of the renal cortex were stained with hematoxylin. Representative light microscope (magnification ×200) from each of the rat groups are shown: (A) Normal glomerulus from non-diabetic rat at eight weeks; (B) glomerulus from untreated STZ diabetic rats at eight weeks showing hypertrophy; irregular, denued glomerular basement membrane, mesangial expansion; and global glomerulosclerosis; with the symptoms of early diabetic nephropathy symptoms; (C) glomerulus from rats treated with eight weeks of PPE, depicting partial reversal of glomerulosclerosis.

Figure 8. Panel D shows the normal tubulointerstitial structure of vehicle-treated rat kidneys. Panels E and F show prominent interstitial damage, tubular hypertrophy, inflammatory cell infiltration, and thickening of tubular basement membrane in the STZ diabetic control rats. Panels G and H from polyphenolic extract-treated rat kidney show improved structure of tubulointerstitial with minimal injury.
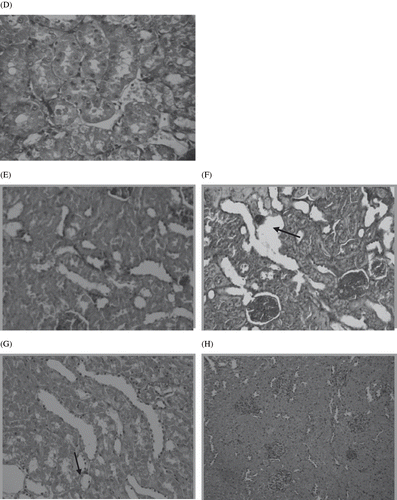
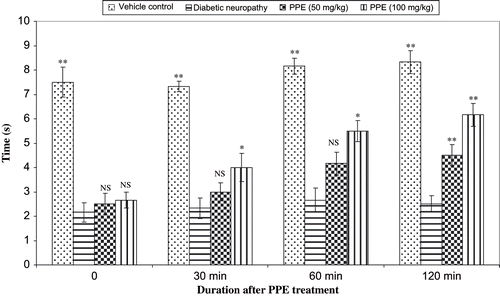
Figure 8. Panel D shows the normal tubulointerstitial structure of vehicle-treated rat kidneys. Panels E and F show prominent interstitial damage, tubular hypertrophy, inflammatory cell infiltration, and thickening of tubular basement membrane in the STZ diabetic control rats. Panels G and H from polyphenolic extract-treated rat kidney show improved structure of tubulointerstitial with minimal injury.
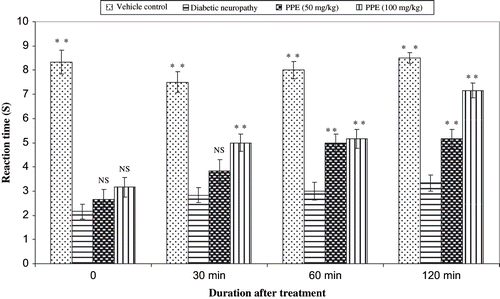
Figure 9. Effect of polyphenolic extract on the reaction time in diabetic mice using tail immersion in hot water (55 ± 0.5°C). Values are expressed as mean ± SEM of six animals. **P < 0.01 and *P < 0.05 compare with diabetic animals.

Figure 9. Effect of polyphenolic extract on the reaction time in diabetic mice using tail immersion in hot water (55 ± 0.5°C). Values are expressed as mean ± SEM of six animals. **P < 0.01 and *P < 0.05 compare with diabetic animals.

Figure 10. Effect of polyphenolic extract on the reaction time in diabetic mice using hot plate (55 ± 1°C) method. Values are expressed as mean ± SEM of six animals in each groups. **P < 0.01 and *P < 0.05 compare with diabetic animals.

Figure 10. Effect of polyphenolic extract on the reaction time in diabetic mice using hot plate (55 ± 1°C) method. Values are expressed as mean ± SEM of six animals in each groups. **P < 0.01 and *P < 0.05 compare with diabetic animals.

Reprints and Corporate Permissions

Please note: Selecting permissions does not provide access to the full text of the article, please see our help page How do I view content?

To request a reprint or corporate permissions for this article, please click on the relevant link below:

Academic Permissions

Please note: Selecting permissions does not provide access to the full text of the article, please see our help page How do I view content?

Obtain permissions instantly via Rightslink by clicking on the button below:

If you are unable to obtain permissions via Rightslink, please complete and submit this Permissions form. For more information, please visit our Permissions help page.