Figures & data
Table 1 Systolic blood pressure (SBP) and 24-hour urine volume (V) at the beginning and end of pregnancy of dams submitted to normal sodium intake (control) or increased sodium intake (saline)
Table 2 Systolic blood pressure (SBP) of thirty- and sixty-day-old rat pups from dams submitted to high-sodium intake (saline group) and same-age control rats before surgery
Table 3 Sytolic blood pressure (SBP, mmHg) of rats subjected to 5/6 nephrectomy (NE) or a sham operation (S), born from dams submitted to high (SS, NES) or normal (S, NE) sodium intake, 30, 60 and 90 days after the operation
Table 4 Glomerular filtration rate (GFR, ml/min/100 g) and albumin urinary excretion (albuminuria, mg/24 h) of rats from dams submitted to high-sodium intake (SS, NES) and same-age controls (S) at 120 days after nephrectomy (NE, NES) or to sham operation (S, SS)
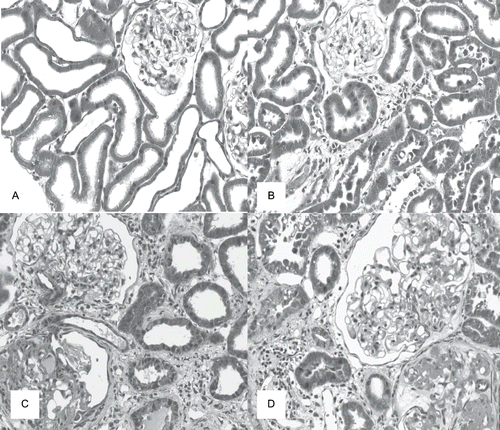
Figure 1. Masson's trichrome stained histological sections of renal cortex of rats from dams submitted to high-sodium intake (B and D) and of the same age control rats (A and C) at 120 days after nephrectomy (C and D) or a sham operation (A and B), × 280.

Table 5 Glomerulosclerosis (GS) and tubulointerstitial lesions (TIL) scores of rats from dams submitted to high-sodium intake (SS and NES) and of the same age controls rats (S) at 120 days after nephrectomy (NE) or sham operation (S)
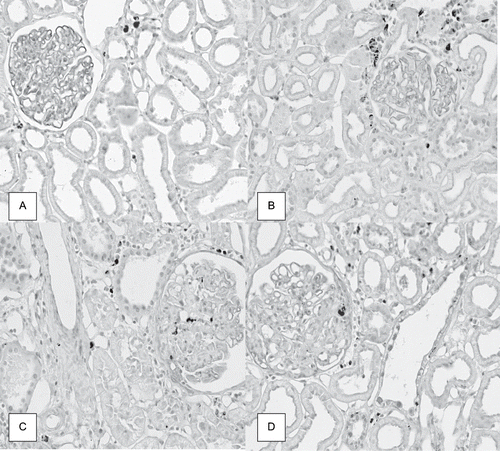
Figure 2. Immunolocalization of ED1 (macrophages/monocytes) in renal cortex of rats from dams submitted to high-sodium intake (B and D) and of the same age control rats (A and C) at 120 days after nephrectomy (C and D) or a sham operation (A and B), × 280.

Table 6 Number of ED1-positive cells per glomerulus or per area of renal cortical tubulointerstitium, measuring 0.245 mm2 each, of rats from dams submitted to high-sodium intake (SS and NES) and of the same age controls rats (S) at 120 days after nephrectomy (NE) or sham operation (S)