1,126
Views
44
CrossRef citations to date
0
Altmetric
Laboratory Studies

Effect of Genistein, a Soy Isof lavone, on Whole Body Insulin Sensitivity and Renal Damage Induced by a High-Fructose Diet

, &
Pages 645-654 | Published online: 07 Jul 2009

Figures & data

Table 1 Composition of diet (g/100 g)

Table 2 Changes in body weight, kidney weight, and urine volume of experimental animals

Table 3 Plasma glucose, insulin, and insulin sensitivity indices of experimental animals

Figure 1. Oral glucose tolerance test curves of experimental animals. Values are means ± SD (n = 6). CON: control rats; FRU: fructose-fed rats; FRU + GEN: fructose-fed rats treated with genistein (1mg/kg b.w); CON + GEN: control rats treated with genistein (1mg/kg b.w). asignificant at p < 0.05 compared to CON ANOVA followed by DMRT.
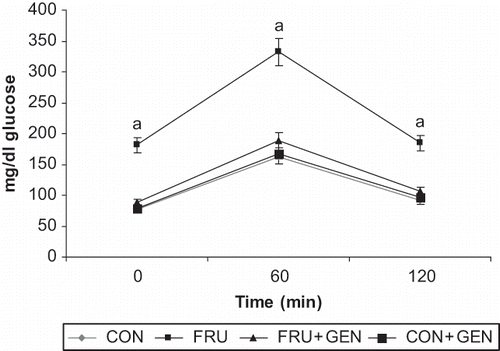
Figure 1. Oral glucose tolerance test curves of experimental animals. Values are means ± SD (n = 6). CON: control rats; FRU: fructose-fed rats; FRU + GEN: fructose-fed rats treated with genistein (1mg/kg b.w); CON + GEN: control rats treated with genistein (1mg/kg b.w). asignificant at p < 0.05 compared to CON ANOVA followed by DMRT.

Table 4 Levels of urea, uric acid, creatinine, total protein, and albumin in plasma of experimental rats

Table 5 Urinary urea, uric acid, creatinine, and albumin of experimental animals

Table 6 Levels of sodium and potassium in plasma (mEq/L) and urine (mmol/L/day) of experimental animals

Table 7 Urea and creatinine clearance rate (ml/min) in experimental animals

Table 8 Levels of thiobarbituric reactive substances (TBARS) and reduced glutathione (GSH) in kidney of experimental rats

Figure 2. Histopathology of kidney using hematoxylin and eosin (A–G; H&E × 20). Control rats showed normal glomeruli and tubules (). represent kidney section of high-fructose-fed rats. shows tubules having fatty infiltration. shows segmented glomerulo nephritis, with the tubules showing fat accumulation. shows hyaline casts in tubules. shows fatty infiltration in parenchyma cells, and represents the kidney section of fructose-fed rats treated with genistein, showing cloudy swelling and mild fat accumulation in tubules. represents the kidney section of normal rats treated with genistein in which the glomeruli show mild congestion.
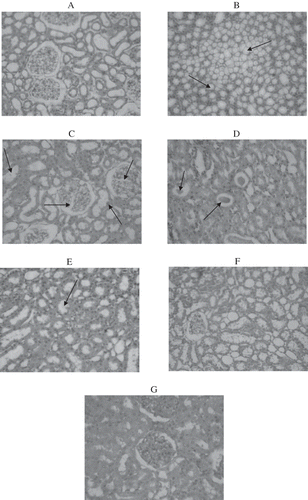
Figure 2. Histopathology of kidney using hematoxylin and eosin (A–G; H&E × 20). Control rats showed normal glomeruli and tubules (Figure 2A). Figures 2B–2E represent kidney section of high-fructose-fed rats. Figure 2B shows tubules having fatty infiltration. Figure 2C shows segmented glomerulo nephritis, with the tubules showing fat accumulation. Figure 2D shows hyaline casts in tubules. Figure 2E shows fatty infiltration in parenchyma cells, and Figure 2F represents the kidney section of fructose-fed rats treated with genistein, showing cloudy swelling and mild fat accumulation in tubules. Figure 2G represents the kidney section of normal rats treated with genistein in which the glomeruli show mild congestion.

Reprints and Corporate Permissions

Please note: Selecting permissions does not provide access to the full text of the article, please see our help page How do I view content?

To request a reprint or corporate permissions for this article, please click on the relevant link below:

Academic Permissions

Please note: Selecting permissions does not provide access to the full text of the article, please see our help page How do I view content?

Obtain permissions instantly via Rightslink by clicking on the button below:

If you are unable to obtain permissions via Rightslink, please complete and submit this Permissions form. For more information, please visit our Permissions help page.