Figures & data
Table 1 Patients‘ biometric data, hemodynamics, score values, and operation and transfusion data
Figure 1. Changes of diuresis and urea in the study groups. (1significant differences to the time of admission, 2significant differences between the groups, p < 0.05.)
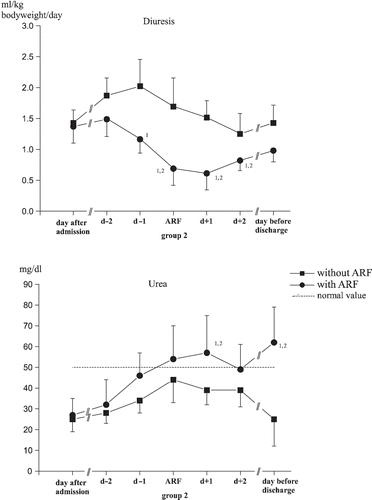
Figure 2. Changes of creatinine in serum and creatinine clearance in the study groups. (1significant differences to the time of admission, 2significant differences between the groups, p < 0.05.)
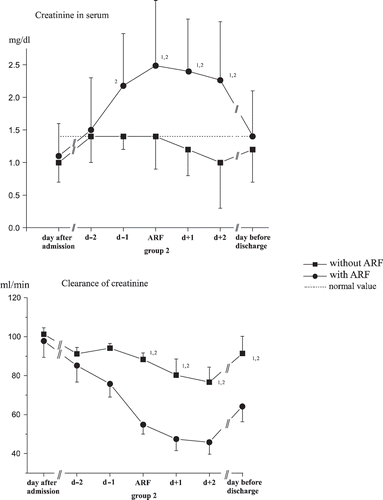
Figure 3. Changes in excretion of α1-microglobulin (α1-MG) and N-Acetyl-ß-D-Glucosaminidase (NAG). (1significant differences to the time of admission, 2significant differences between the groups, p < 0.05.)
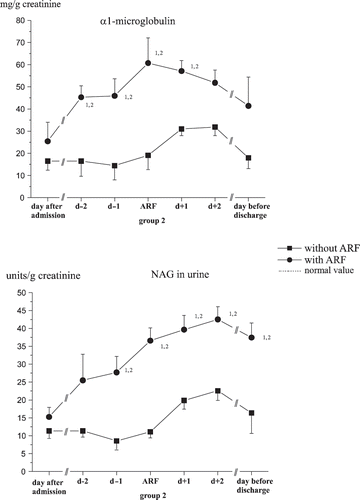
Figure 4. Changes in excretion of total protein. (1significant differences to the time of admission, 2significant differences between the groups, p < 0.05.)
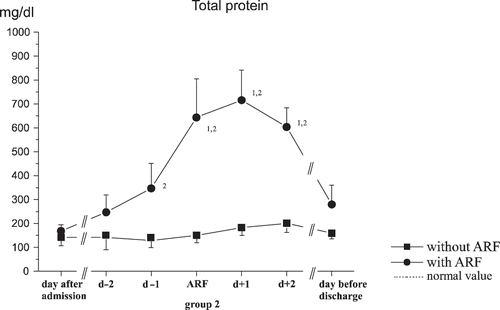
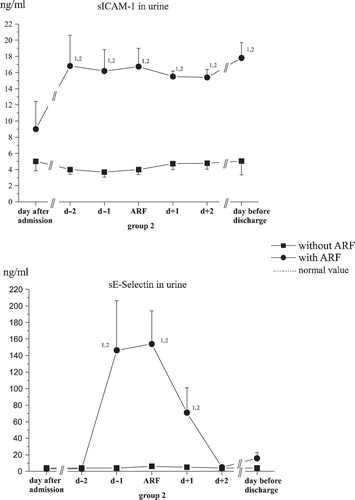
Figure 5. Changes of excretion of sICAM-1 and sE-Selectin in urine. (1significant differences to the time of admission, 2significant differences between the groups, p < 0.05.)