Figures & data
Table 1 Oligonucleotide sequence of primers used for RT-PCR
Table 2 Clinical and metabolic parameters in the three groups
Table 3 Oxidative stress parameters in the three groups of rats
Figure 1. Representative micrographs of kidney tissue stained with HE from (A) NC, (B) DM, and (C) DM + TAU. Glomerular hypertrophy was evident in the untreated diabetic group, but glomerular size was reduced by taurine treatment. Original magnification × 400.
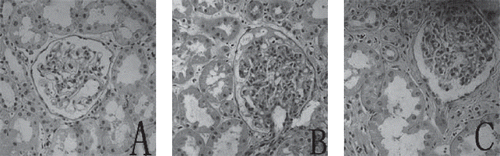
Figure 2. Representative micrographs of immunostaining for ICAM-1 in renal tissue from three groups: (A) seldom specific immunoreactivity in the NC group; (B) strong immunoreactivity for ICAM-1 on the glomerulus and peritubular capillaries (arrow) in DM group; (C) significantly reduced immunoreactivity staining of ICAM-1 on the glomerulus and peritubular capillaries (arrow) in DM + TAU group. Original magnification × 200.
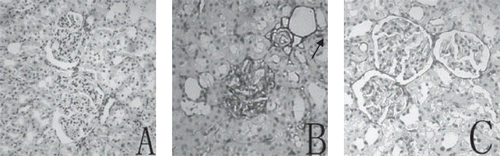
Figure 3. (A) ICAM-1 index in glomerulus, and (B) immunostaining area fraction of ICAM-1 in interstitium in NC, DM, and DM + TAU rats. Values are the mean ± SEM. *p < 0.01 vs. NC, #p < 0.01 vs. DM.
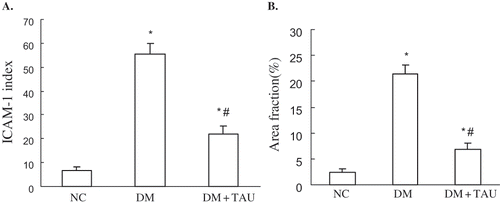
Figure 4. (A) Western blot analysis of LOX-1 protein, and (B) densitometric analysis in renal tissue in NC, DM, and DM + TAU groups. Values are the mean ± SEM. *p < 0.01 vs. NC, #p < 0.01 vs. DM.
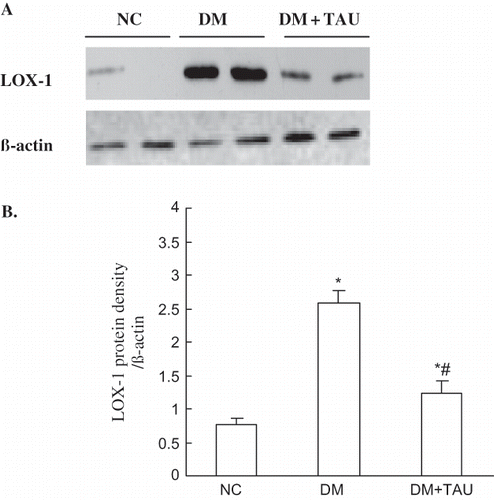
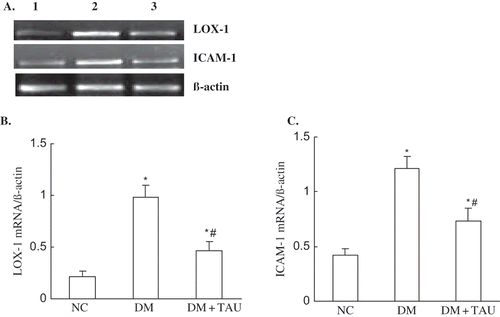
Figure 5. (A) RT-PCT analysis of LOX-1 and ICAM-1 mRNA, and (B and C) densitometric analysis in renal tissue in NC, DM, and DM +TAU rats. Lane 1 shows normal control, lane 2 shows DM, and lane 3 shows DM + TAU. Values are the mean ± SEM. *p < 0.01 vs. NC, #p < 0.01 vs. DM.