
Figures & data
Figure 1. Number of renal biopsy cases (1994–2014).
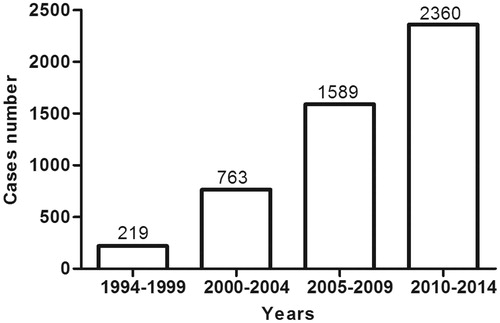
Figure 2. Proportion of patients with renal biopsy at different ages in different periods. *p < 0.05 and ***p < 0.001.
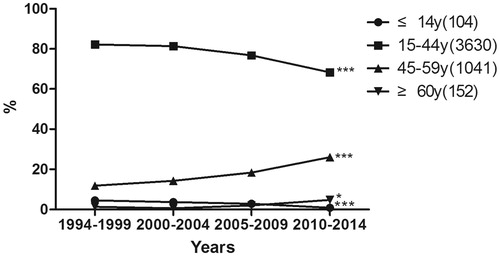
Table 1. Classification of renal diseases based on 4931 renal biopsies.
Table 2. Prevalence of primary GD.
Table 3. Prevalence of secondary GD.
Figure 3. Prevalence of various primary and secondary GD according to periods. Panel A shows the changing spectrum of primary GD between 1994 and 2014, and panel B shows that of secondary GD. *p < 0.05, **p < 0.01, and ***p < 0.001.
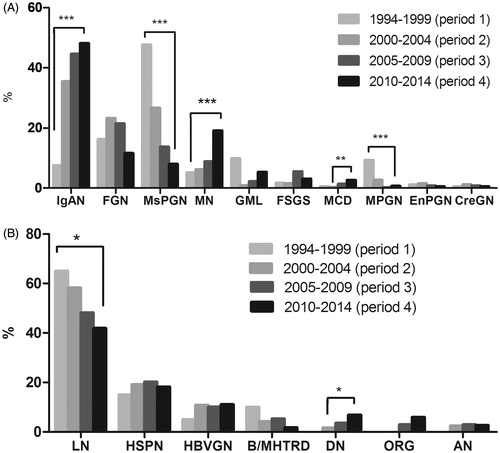
Figure 4. Prevalence of various primary and secondary GD according to age. Panel A shows the spectrum of primary GD after age stratification, and panel B shows that of secondary GD.
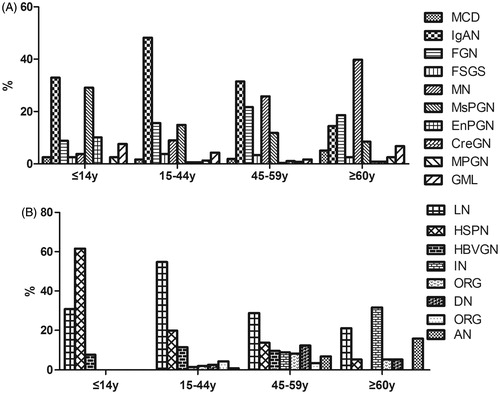
Figure 5. The clinical indications for renal biopsy according to periods.
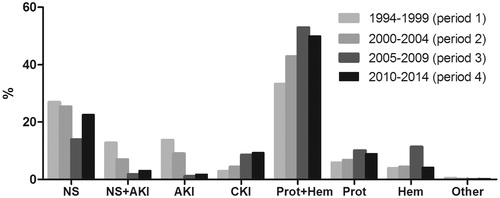
Table 4. The clinicopathologic correlation of biopsy-proven renal diseases.