
Figures & data
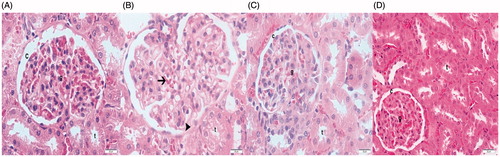
Figures 1. H&E staining. (A) Control group. Light microscopy of a glomerulus demonstrating typically glomerular (g) structures. Bowman’s capsular space (c) × 40. (B) OVX group. Glomerular hypertrophy with capillary dilation (arrow). Atrophic tubules (t). Bowman’s capsule narrowing (arrow head). × 40. (C) Ovx + bortezomib group. Typical glomerulus (g). Bowman’s parietal line cell (arrow head). × 40 (D) OVX +17β-estradiol group. Typical glomerulus (g). Bowman’s parietal line cell (arrow head). × 40.
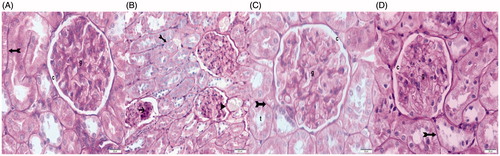
Figures 2. PAS staining. (A) Control group. Bowman’s capsule (g). Bowman’s capsular space (c). × 40. (B) OVX group. Thickening of Bowman’s parietal cell basement membrane with atypical parietal cell (arrow head). Focal glomerulosclerosis (arrow). İrregular tubular basement membrane (tailed arrow). × 20. (C) Ovx + bortezomib group. Regular Bowman’s capsule (g). Bowman’s capsular space (c). × 40. (D) OVX +17β-estradiol group. Typical Bowman’s capsule (g). Bowman’s capsular space (c). Regular tubular basement membrane (tailed arrow). × 40.
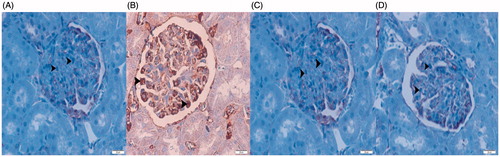
Figures 3. NF-kB/p65 IHC staining. Imunolocalization of NF-kB/p65 (B) and caspas-3 (F) positive mesangial cells, examined under light microscopy, from renal cortex. (A) Control group. (B) OVX group. (C) Ovx + bortezomib group. (D) OVX +17β-estradiol group. Original magnification × 40.
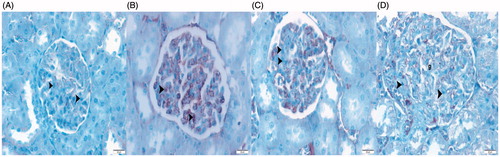
Figures 4. Caspas-3 IHC staining. Imunolocalization of caspas-3 (F) positive mesangial cells, examined under light microscopy, from renal cortex. (A) Control group. (B) OVX group. (C) Ovx + bortezomib group. (D) OVX +17β-estradiol group. Original magnification × 40.
Figures 5. Tranmission electron microscopic micrographs. Uranyl acetate and Reynolds lead citrate stain. (A) Control group. Electron micrographs showing typical glomerular capillary with normal basal lamina (arrow). Normal podocytes with foot process. ×3000. Erythrocytes (e) × 3000. (B) OVX group. Electron micrographs showing glomerular basement membrane thickening. Capillary basement membrane lamina densa, lamina rara interna and externa disappear (asterisk). Reduction in podocyte foot process and foot process infolding (arrow head). ×6000. (C) Ovx + bortezomib group. Podocytes (P). Normal podocytes foot process (arrow head). Typical glomerular capillar basement membrane (arrow). × 5000. (D) OVX +17β-estradiol group. Normal podocytes foot process (arrow head). Typical glomerular capillar basement membrane (arrow). ×10,000. Erythrocytes (e). Capillar lumen (c). Bowman’s capsular space (b).
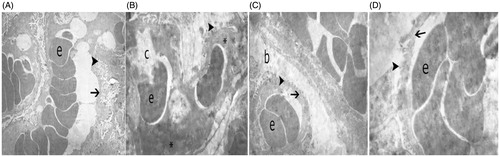
Table 1. NK-κB ve caspase-3 positive cell numerical density (mm2).