Figures & data
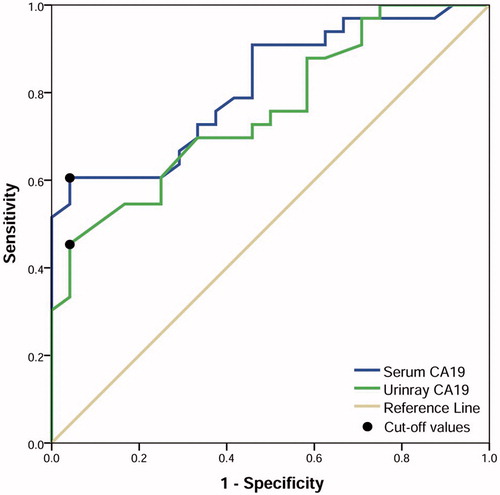
Figure 1. Scatter plots show the correlation between serum (A) and urinary (B) carbohydrate antigen 19-9 concentration and duration of obstruction in patients with ureteral stone.
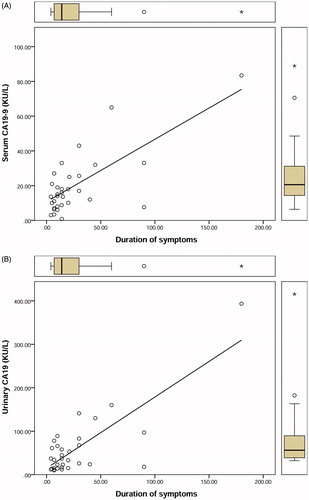
Figure 2. Box plots show the difference in serum (A) and urinary (B) carbohydrate antigen 19-9 concentration in patients with ureteral obstruction lasting <14 days compared to >14 days.
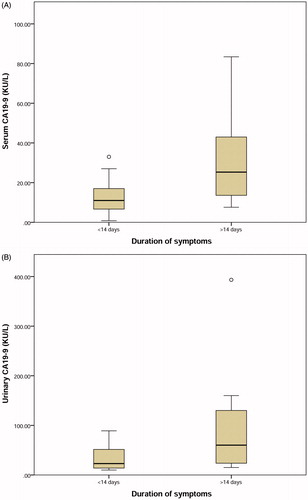
Table 1. Serum and urinary carbohydrate antigen 19-9 levels in study groups (values are shown in median [interquartile range]).
Figure 3. Receiver operating characteristic curve analysis of serum and urinary carbohydrate antigen 19-9 for detecting obstructive hydronephrosis in patients with ureteral stone.