Figures & data
Table 1. Renal functional parameters in study groups.
Figure 1. (A) MDA concentration of study groups. (B) Glutathione concentration of study groups. (C) TNF-α relative expression in study groups. (D) IL-6 relative expression in study groups. *p < 0.05, **p < 0.01 versus group sham and XZK; #p < 0.05, ##p < 0.01 versus group CM; &p < 0.05, versus group CM + ATO. n = 10. Values are mean ± SEM.
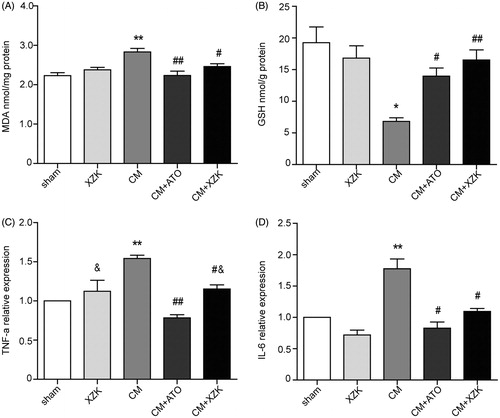
Table 2. Nitric oxide and nitrite/nitrate levels (nmol/mg protein) in study groups (mean ± SEM).
Figure 2. Histological changes of renal tissue in study groups (H&E staining, scale bar, 100 μm). (A) Tubular necrosis. Tubular necrosis was graded as follows: no damage (0), mild (1, patchy isolated damage), moderate (2, damage less than 25%), severe (3, damage between 25 and 50%), and very severe (4, more than 50% damage). (B) Medullary congestion, The degree of medullary congestion was defined as follows: no congestion (0), mild (1, vascular congestion with identification of erythrocytes by ×400 magnification), moderate (2, vascular congestion with identification of erythrocytes by ×200 magnification), severe (3, vascular congestion with identification of erythrocytes by ×100 magnification) and very severe (4, vascular congestion with identification of erythrocytes by ×40 magnification). (C) Proteinaceous casts. Proteinaceous casts were graded as follows: no damage (0), mild (1, unicellular, patchy isolated damage), moderate (2, damage less than 25%), severe (3, damage between 25 and 50%), and very severe (4, more than 50% damage). *p < 0.01 versus group sham and group XZK; #p < 0.05, ##p < 0.01 versus group CM. n = 10. Values are mean ± SEM.
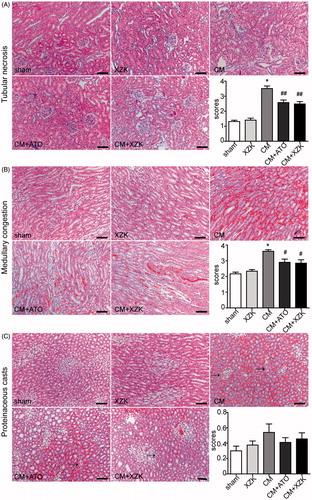
Figure 3. TUNEL staining in study groups. TUNEL-positive cells were stained brightly green. Scale bar, 100 μm. *p < 0.01 versus group sham and group XZK; #p < 0.01 versus group CM. n = 10. Values are mean ± SEM.
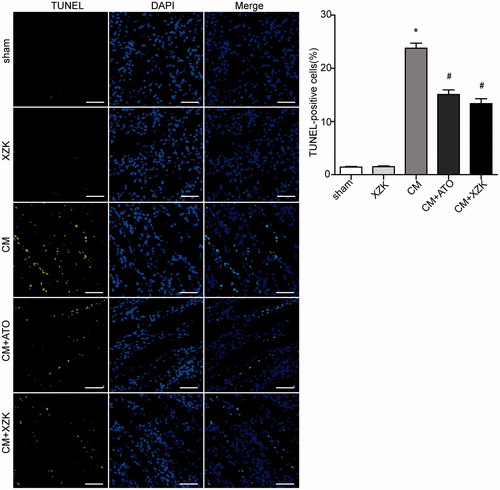
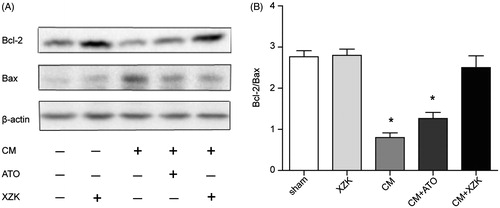
Figure 4. (A) Bax and Bcl-2 protein expression by Western blotting. (B) The ratio of Bcl-2/Bax expression. *p < 0.01 versus group sham, group XZK and group CM + XZK. Western blots were repeated at least by three independent times.