Figures & data
Table 1. Initial and the final body weight and the weight of heart in all groups.
Table 2. The serum level of CRP, glucose, lipid profile, and number of mortality in rats.
Table 3. Serum level of CK and LDH activity.
Figure 1. Effect of PSO on serum creatinine and urea. *p < 0.05; **p < 0.01; ***p < 0.001 compared with STZ-treated group at the same time.
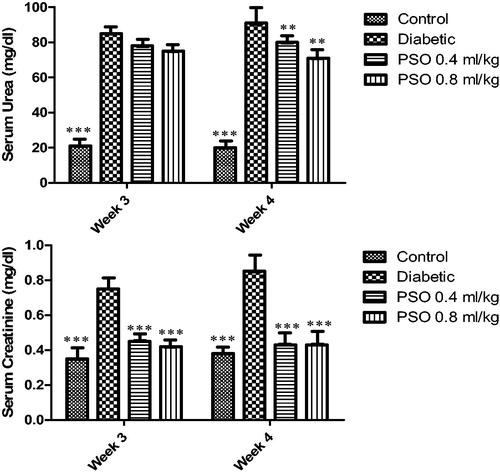
Table 4. Urine volume, glucose and protein.
Figure 2. Effect of PSO on MDA and total thiol content of tissue homogenates. *p < 0.05; **p < 0.01; ***p < 0.001 compared with STZ-treated group at the same time.
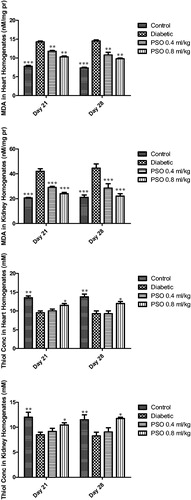
Figure 3. Comparison of structural changes in the kidney due to injection of STZ and treatment by PSO between groups. (A) Represents a normal rat kidney. All anatomical structures look normal (×100), (B) group 2 treated with STZ 65 mg/kg, severe inflammatory cells infiltration and hyaline casts (×400), and (C) minimal inflammatory cells infiltration and moderate glomerular congestion have been seen (×400).
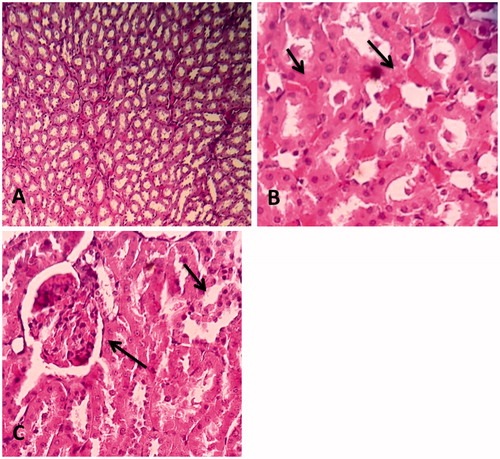
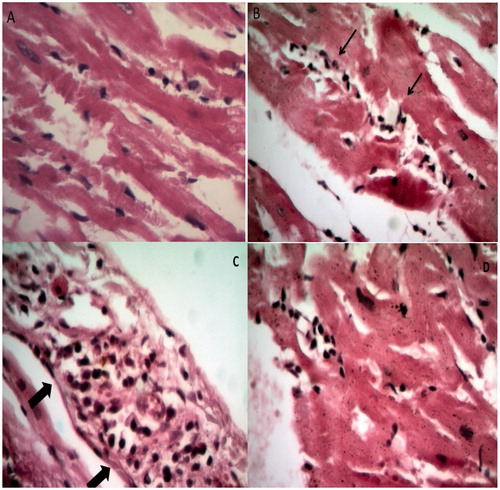
Figure 4. Comparison of structural changes in the heart due to injection of STZ and treatment by PSO between groups. (A) Represents a normal rat cardiomyocyte. All anatomical structures look normal (×400), (B) group 2 treated with STZ 65 mg/kg, disperse and centralized cardiomyocytes degeneration and inflammatory cells infiltration (×400), (C) pericardial infiltration in STZ-treated group (×400), and (D) group 4 treated with PSO 0.8 mL/kg, followed by STZ injection, lesser histopathological findings than STZ-treated group (×400).