
Figures & data
Figure 1. (a) MRM chromatograms and calibration curves of 100 mg mL−1 of tryptophan analyzed using UPLC-ESI-MS/MS. (b) MRM chromatograms and calibration curves of 100 mg mL−1 of kynurenine analyzed using UPLC-ESI-MS/MS.
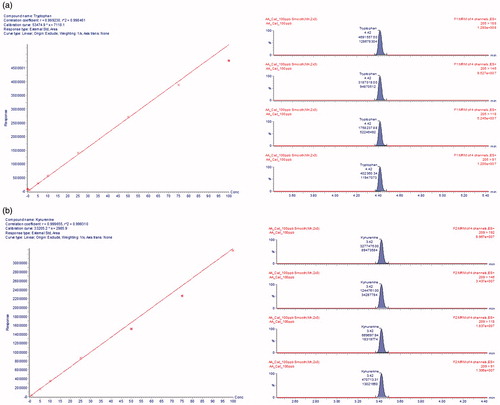
Table 1. Method parameters for tryptophan and kynurenine using UPLC-ESI-MS/MS.
Table 2. Analytical parameters of UPLC-MS/MS method validation.
Figure 2. Serum IDO concentrations between the groups.
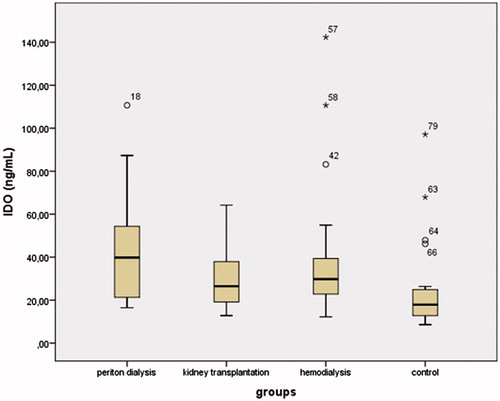
Figure 3. Serum tryptophan concentrations between the groups.
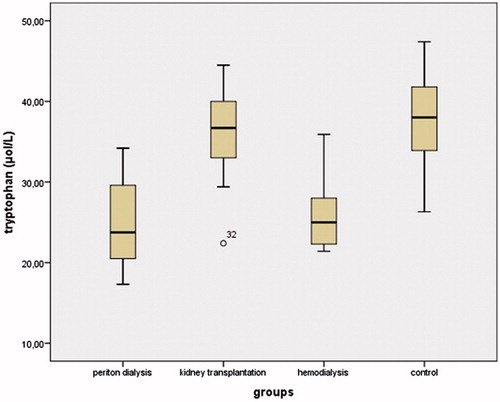
Figure 4. Serum kynurenine concentrations between the groups.
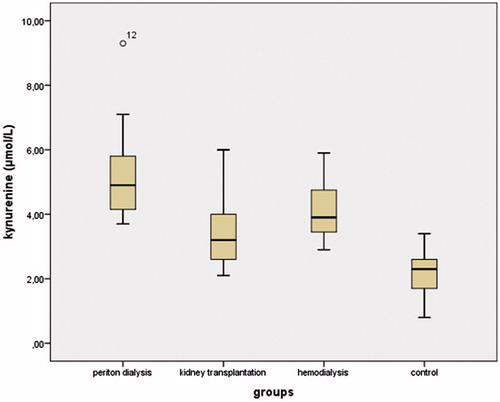
Figure 5. Serum kynurenine to tryptophan ratio between the groups.
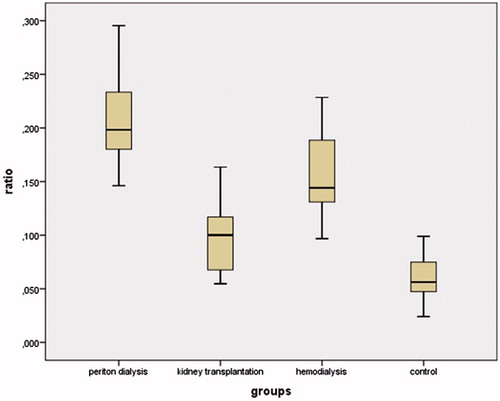
Table 3. Comparison of demographic and characteristics of the patients and healthy controls (mean ± SD).
Table 4. The correlations of BUN and creatinine with gender, IDO, KYN, TRP, KYN/TRP ratio (n = 81).