
Figures & data
Figure 1. Agarose gel electrophoresis (2%) pattern of GSTM1 and GSTT1 multiplex PCR. From left to right lane 1 shows 100 base pairs DNA molecular weight marker; GSTT1 yields a product of 480 bp, whereas the amplification product of GSTM1 is 230 bp and β-globin gene (268 bp) as an internal control. Lanes 2 GSTT1/GSTM1 genotypes, lanes 3 GSTT1/GSTM1null genotypes, lanes 4 and 7 GSTT1null/GSTM1 genotypes, lanes 5, and 6 GSTT1null/GSTM1null genotypes.
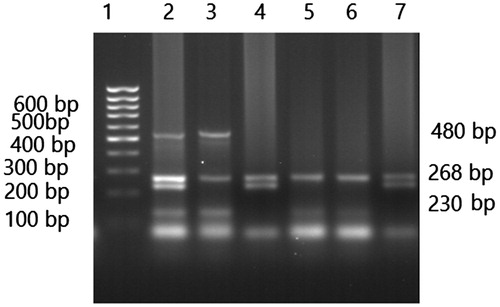
Table 1. Primers and PCR conditions for all the GSTs variants.
Figure 2. A total of 12% polyacrylamide gel pattern of GSTP1 polymorphism digested PCR products with ALW26I enzyme. From left to right lane 1 indicate lanes 1 homozygous Val/Val, lane 2 heterozygote Ile/Val, lane 3 wild type Ile/Ile, lane 4 PCR product, and lane 5 molecular marker.
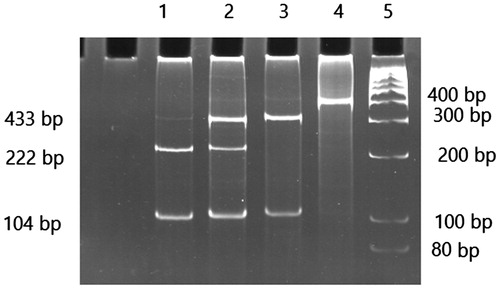
Table 2. Characteristics and distribution of risk factors in patients with ESRD and control subjects in a population from western Iran.
Table 3. Distribution of GST M1 & T1 genotypes in patients with ESRD and control subjects.
Table 4. Odds ratios of GST M1 & T1 genotypes in patients with ESRD after adjustment for sex and age.
Table 5. The relationship between GST T1 & M1 genotypes with TAC and MDA between ESRD patients and control subjects.
Table 6. The distribution and odds ratios of GST P1 genotypes and alleles in patients with ESRD after adjustment for sex and age.