Figures & data
Figure 1. Flow diagram of studies of hepatitis B virus-related kidney disease considered for inclusion.
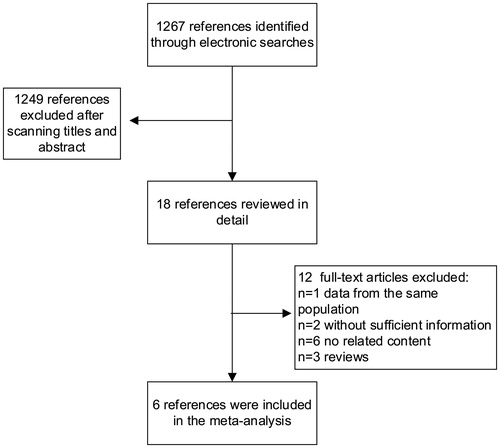
Table 1. Characteristics and outcomes of studies included in the meta-analysis.
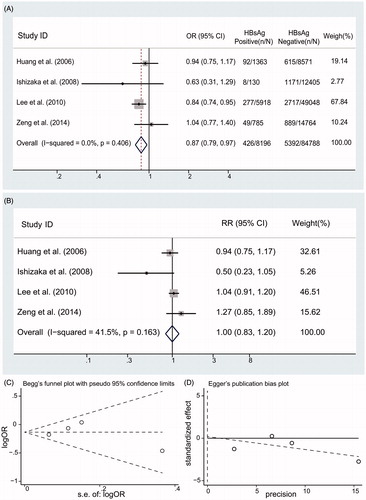
Figure 2. Summary estimate for RR of CKD according to HBsAg serologic status (A) Summary estimate for OR of CKD according to HBsAg serologic status; (B) Summary estimate for adjusted RR of CKD according to HBsAg serologic status; (C) Begg’s funnel plot; (D) Egger’s funnel plot.
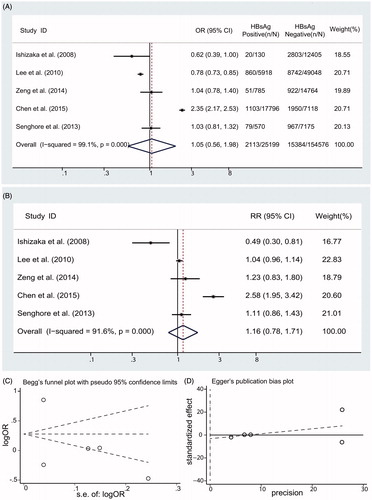
Figure 3. Summary estimate for RR of low eGFR according to HBsAg serologic status (A) Summary estimate for OR of low eGFR according to HBsAg serologic status; (B) Summary estimate for adjusted RR of low eGFR according to HBsAg serologic status; (C) Begg’s funnel plot; (D) Egger’s funnel plot.
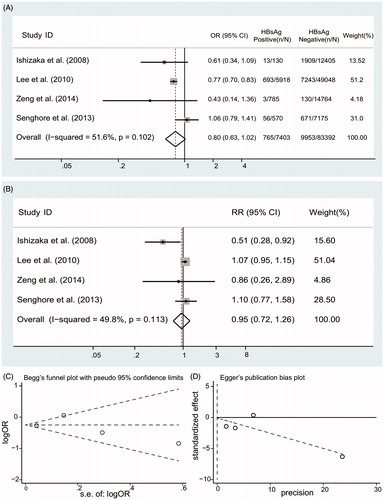
Figure 4. Summary estimate for RR of proteinuria according to HBsAg serologic status (A) Summary estimate for OR of proteinuria according to HBsAg serologic status; (B) Summary estimate for adjusted RR of proteinuria according to HBsAg serologic status; (C) Begg’s funnel plot; (D) Egger’s funnel plot.