Figures & data
Figure 1. Assessments of transfection efficiency and silencing efficiency of siRNA. (a) Under normoxia, HK-2 cells were transfected with siGLO red transfection indicators for 24 h. HK-2 cells were observed under bright field and confocal microscope in the same field (magnification 200×), respectively. (b) Under normoxia, HK-2 cells were transfected with HIF-1α siRNA at different concentrations (0, 25 nM, 50 nM, and 100 nM). Real-time PCR was used to quantify the mRNA expression of HIF-1α. Silencing efficiency of HIF-1α siRNA at 0 nM was defined as 0%. Silencing efficiency of HIF-1α siRNA = amount of HIF-1α mRNA at some concentration/amount of HIF-1α mRNA at 0 nM (%). Results (means ± SD) are from 3 sets of experiments.
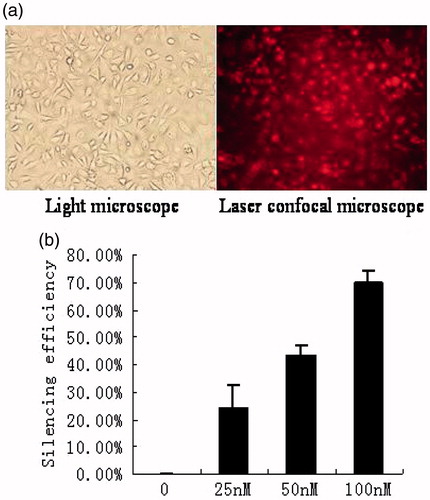
Figure 2. Silencing HIF-1α gene aggravates cell growth inhibition. (1) normoxia group; (2) hypoxia-like group; (3) transfection reagent group; (4) negative control group; (5) HIF-1α siRNA group. The growth inhibitory rate of HK-2 cells in HIF-1α siRNA group increased significantly compared to those in hypoxia-like group, transfection reagent group, and negative control group (*p < .05). Results (means ± SD) are from 6 sets of experiments.
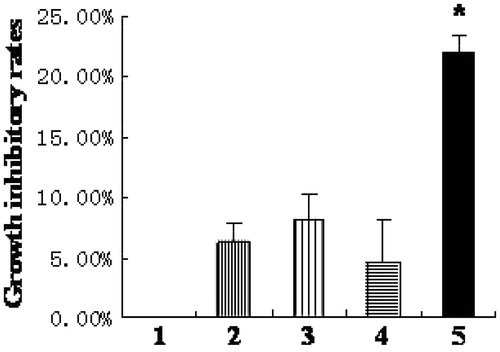
Figure 3. Apoptosis of HK-2 cells examined by TUNEL assay (magnification 200×). (1) normoxia group; (2) hypoxia-like group; (3) transfection reagent group; (4) negative control group; (5) HIF-1α siRNA group. Apoptotic index of normoxia group was significantly lower than the other four groups (*p < .05). Results (means ± SD) are from 6 sets of experiments.
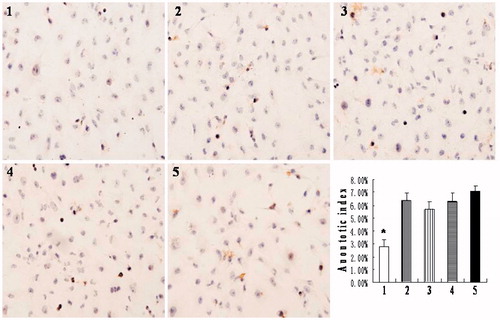
Figure 4. Apoptosis of HK-2 cells examined by expression of caspase-3 protein and flow cytometry. (1) normoxia group; (2) hypoxia-like group; (3) transfection reagent group; (4) negative control group; (5) HIF-1α siRNA group. (a) Expression of caspase-3 and tubulin protein by Western blot. (b) The ratio of caspase-3 to tubulin protein. The caspase-3 protein level of normoxia group was significantly lower than the other four groups (*p < .05). The apoptotic rates (c) of each group were obtained by flow cytometry. Apoptotic rate of normoxia group was significantly lower than the other four groups (*p < .05). Results (means ± SD) are from 6 sets of experiments.
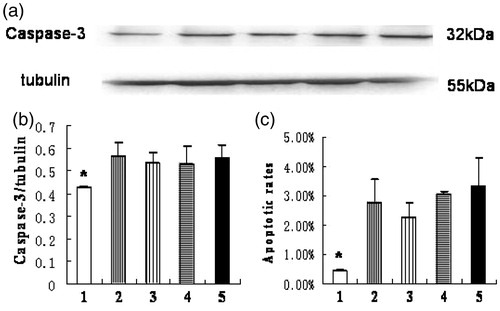
Figure 5. Silencing HIF-1α gene aggravates cell necrosis. (1) normoxia group; (2) hypoxia-like group; (3) transfection reagent group; (4) negative control group; (5) HIF-1α siRNA group. (a) The LDH activity in normoxia group was significantly lower than the other four groups (*p < .05). And the LDH activity in HIF-1α siRNA group was significantly higher than the other four groups (**p < .05). (b) The necrotic rates of each group were obtained by flow cytometry. Results (means ± SD) are from 6 sets of experiments.
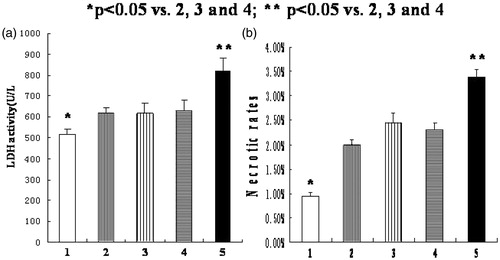
Figure 6. The mRNA expression of HIF-1α, Glut-1, and VEGF in HK-2 cells in different groups. (1) normoxia group; (2) hypoxia-like group; (3) transfection reagent group; (4) negative control group; (5) HIF-1α siRNA group. (a) The mRNA expression of HIF-1α. (b) The mRNA expression of Glut-1. (c) The mRNA expression of VEGF. The mRNA expression of HIF-1α, Glut-1 and VEGF in normoxia group was significantly lower than those in hypoxia-like group, transfection reagent group, and negative control group (*p < .05). And the mRNA expression of HIF-1α, Glut-1, and VEGF in HIF-1α siRNA group was also significantly lower than those in hypoxia-like group, transfection reagent group, and negative control group (**p < .05). Results (means ± SD) are from 6 sets of experiments.
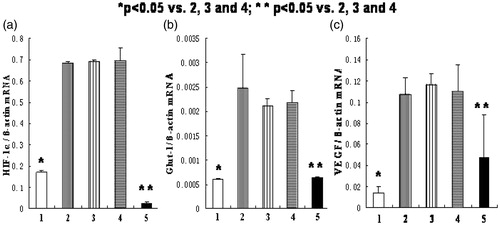
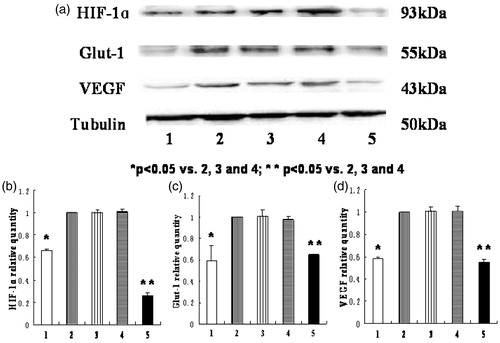
Figure 7. The protein levels of HIF-1α, Glut-1, and VEGF in HK-2 cells in different groups. (1) normoxia group; (2) hypoxia-like group; (3) transfection reagent group; (4) negative control group; (5) HIF-1α siRNA group. (a) The expression of HIF-1α, Glut-1, VEGF, and tubulin protein by Western blot. (b), (c), (d) The relative protein quantity of HIF-1α, Glut-1, and VEGF in different groups. The expression of target proteins in hypoxia-like group was defined as one, and the ratios of target proteins in other groups to those in hypoxia-like group were the relative quantity. The protein levels of HIF-1α, Glut-1, and VEGF in normoxia group were significantly lower than those in hypoxia-like group, transfection reagent group, and negative control group (*p < .05). And the protein levels of HIF-1α, Glut-1, and VEGF in HIF-1α siRNA group were also significantly lower than those in hypoxia-like group, transfection reagent group, and negative control group (**p < .05). Results (means ± SD) are from 6 sets of experiments.