
Figures & data
Table 1. Comparison of pretreatment and post-treatment serum creatinine levels.
Figure 1. Total histopathological scoring and BrdU DNA fragmentation scores between groups.
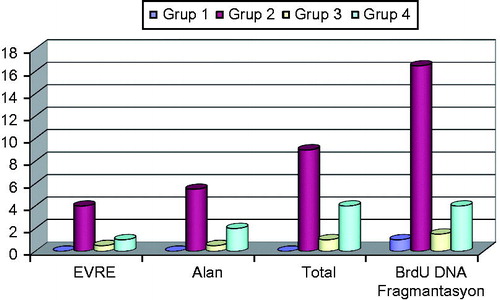
Figure 2. Histopathologic findings. (A, H&E; ×200) This picture shows degenere-necrotic tubules (arrows) in Kolistin group. (B, H&E; ×400) High magnification, vacuolar degeneration (arrowhead) and tubular dilatation in tubules. (C, H&E; ×600) High magnification, necrotic tubules with prominent nucleoli. (D, H&E; ×400) This picture displays extensive cortical necrosis (grade 3) without glomerular damage in Kolistin group. (E, H&E; ×400) Decreased tubular damage (arrows) seen in Kolistin and Luteolin group. (F, H&E; ×200) Improved toxicity with minimal tubular damage seen in Luteolin group (compare to D).
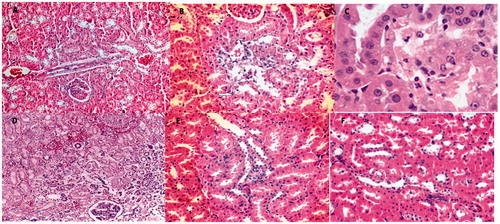
Figure 3. Immuno-fluorescent findings: Insitu BrdU DNA fragmentation; (A) scarce apoptotic cells at the tubulus epithelium in the Control Group (orange; ×200). (B) (red; ×200). (C) (blue; ×200). (D) Apoptotic cells that display significant signal density at the tubulus epithelium in the Colistin Group (orange; ×200). (E) (red; ×200). (F) (blue; ×200). (G) Apoptotic cells that display sparse signal density at the tubulus epithelium in the Luteolin group (orange; ×200). (H) (red; ×200). (I) (blue; ×200). (J) Apoptotic cells that display sporadic intensive signal density at the tubulus epithelium in the Colistin Group + Luteolin Group (orange; ×200). (K) (red; ×200). (L) (blue; ×200).
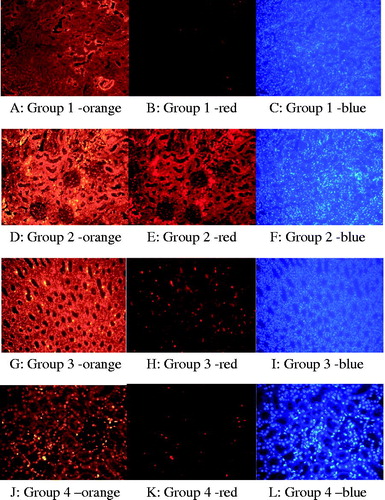
Table 2. TUNEL results and renal histological damage scoring in all experimental groups.