
Figures & data
Figure 1. Photomicrographs illustrate morphological (H&E, ×200) (A–C) and apoptotic (active caspase-3, ×400) (D–F) changes in rat kidney. Control group (A, D), cisplatin group (B, E), cisplatin + curcumin group (C, F). Caspase-3 immunopositive cells (arrows).
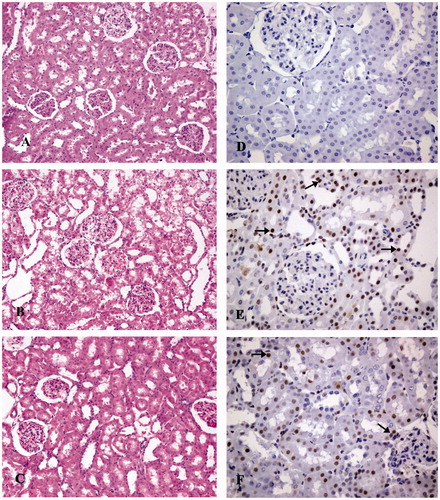
Table 1. Effect of curcumin on renal histopathology, tubular cell apoptosis, and related proteins in cisplatin-induced nephrotoxicity (mean ± SD, n = 6).
Figure 2. Immunohistochemical staining for phospho-p53 (×200) (A–C), Fas (D–F) (×400), and Fas-L (G–I) (×400). Control group (A, D, G), cisplatin group (B, E, H), cisplatin + curcumin group (C, F, I). Immunopositive cells (arrows).
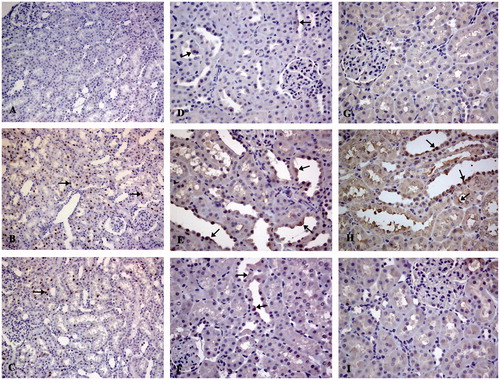
Table 2. Effect of curcumin on renal function, MPO activitiy, MDA, and cytokines levels in cisplatin-induced nephrotoxicity (mean ± SD, n = 6).