Figures & data
Figure 1. Flow cytometry analysis of BM-MSCs after staining with FITC-conjugated CD44 and PE-conjugated CD105 antibodies: CD45 (1.1%), CD44 (76.88%) and CD90 (85%).

Table 1. Gene primer sequences used in PCR.
Table 2. Effect of MSCs infusion on serum glucose and insulin levels in diabetic and diabetic nephropathy-bearing rats (mean ± SE).
Table 3. Effect of MSCs infusion on kidney functions and serum protein contents in diabetic and diabetic nephropathy-bearing rats (mean ± SE).
Table 4. Effect of MSCs infusion on urinary urea, creatinine and microlalbumin concentrations in diabetic and diabetic nephropathy-bearing rats (mean ± SE).
Table 5. Effect of MSCs infusion on serum advanced glycation end products (AGEs) level and heme oxygenase-1 (HO-1) activity in diabetic and diabetic nephropathy-bearing rats (mean ± SE).
Table 6. Effect of MSCs infusion on serum growth factors (TGF-β, FGF-2, and PDGF) levels in diabetic and diabetic nephropathy-bearing rats (mean ± SE).
Figure 2. Agarose gel electrophoresis showing GAPDH, IL-8 and MCP-1 mRNA expression in the kidney tissues by RT-PCR analysis. Lane (1): represents the control group and lane (2): represents diabetic group. Lane (3): represents diabetic nephropathy group, and lanes (4): represents diabetic group treated with MSCs, whereas lanes (5): represents diabetic nephropathy group treated with MSCs. Lane M: represents DNA ladder (100 bp).
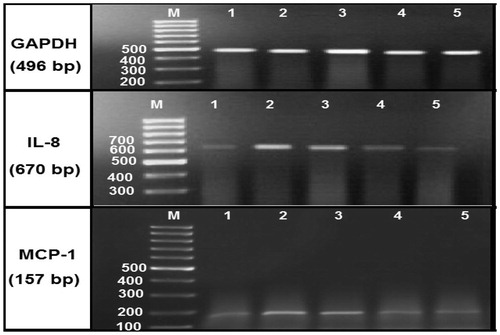
Table 7. Effect of MSCs infusion on iinterlukin-8 (IL-8) and monocyte chemoatractant-1(MCP-1) gene expression level in kidney tissue of diabetic and diabetic nephropathy-bearing rats (mean ± SE).
Figure 3. (a) Photomicrograph of pancreas tissue section of control rats showing no histopathological alteration and the normal histological structure of the islands of Langerhans cells as endocrine portion as well as the acini and duct system as exocrine portion (H&Ex40). (b) Photomicrograph of pancreatic tissue section of diabetic rats showing atrophy in most of the islands of Langerhans cells with pyknosis of their nuclei and congestion in the blood vessels (H&Ex40). (c) Photomicrograph of pancreatic tissue section of diabetic nephroapathy rats showing edema with few inflammatory cells infiltration in the interlobular stroma (H&Ex40). (c1) It shows cystic dilatation in the ducts associated with congestion in the blood vessels (H&Ex40). (d, d1) Photomicrograph of pancreatic tissue section of diabetic rats treated with MSCs showing exocrine acini and fatty change in the lining epithelium with congestion in the blood vessels (H&Ex40). (e, e1) Photomicrograph of pancreatic tissue section of diabetic nephroapathy rats treated with MSCs showing no histopathological alteration in the islands of Langerhans cells, while the ducts showing periductal fibrosis.
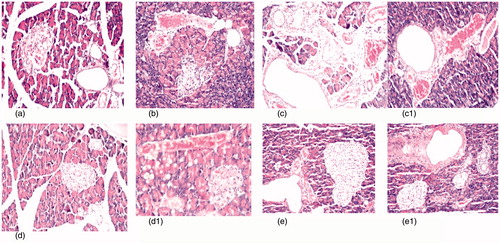
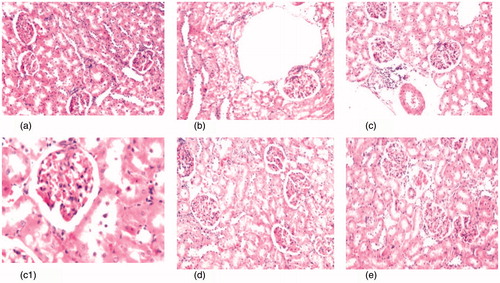
Figure 4. (a) Photomicrograph of kidney tissue section of control rats showing no histopathological alteration and the normal histological structure of the glomeruli and tubules at the cortex are observed (H&Ex40). (b) Photomicrograph of kidney tissue section of diabetic rats showing degenerative changes and nephrosis in the tubular lining epithelium (H&Ex40). (c, c1) Photomicrograph of kidney tissue section of diabetic nephroapathy rats showing degenerative changes and nephrosis in the tubular lining epithelium associated with perivascular inflammatory cells aggregation surrounding the congested blood vessels (H&Ex40) and c1 (H&Ex80). (d) Photomicrograph of kidney tissue section of diabetic rats treated with MSCs showing congestion in the tufts of the glomeruli (H&Ex40). (e) Photomicrograph of kidney tissue section of diabetic nephroapathy rats treated with MSCs showing congestion in the glomeruli and blood vessels (H&Ex40).