Figures & data
Figure 1. CaOx crystal morphology and number (400×). (A) Crystal formation in the control group during the crystal dissolution test. (B) RPA extract (64.0 mg/mL) was added to the formed CaOx crystals for 24 h. (C) Number of crystals in the two tests.
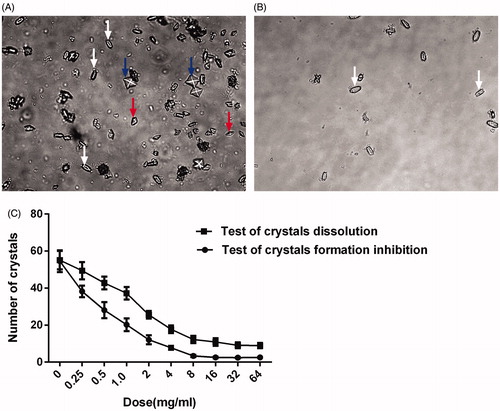
Table 1. Biochemical variables in urine and kidney tissue (x ± s).
Figure 2. Histopathology and crystal deposition in the rat kidney. (A) Gross anatomy of the kidney (left to right: groups A, B, D and F). (B) Micrograph of HE-stained renal tissue. (C) Pathological alterations and CaOx-deposition scores. Green arrows indicate renal crystals; red arrows indicate inflammatory infiltration. The data are presented as the mean ± SD. *p < .05 compared with group A; #p < .05 compared with group B; and $p < .05 compared with group E.
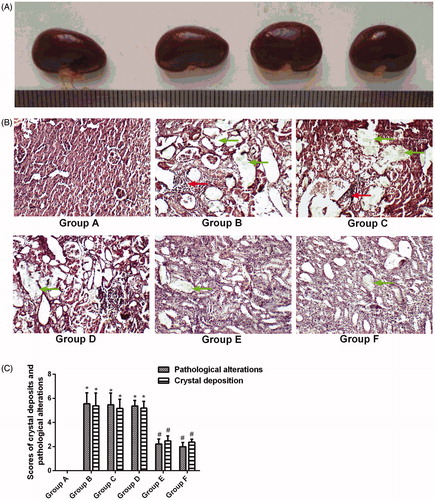
Figure 3. Bacterial urine cultures. (A) group A; (B) group B; (C) group D; and (D) group F.
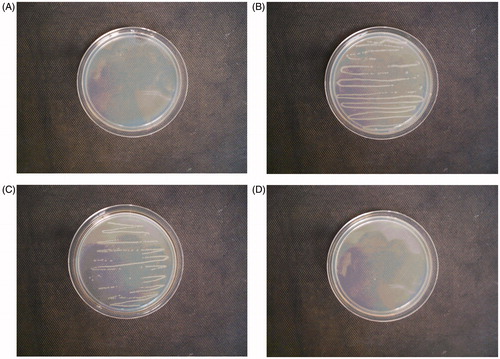
Figure 4. OPN immunostaining (A–F) in renal tissue (200×).
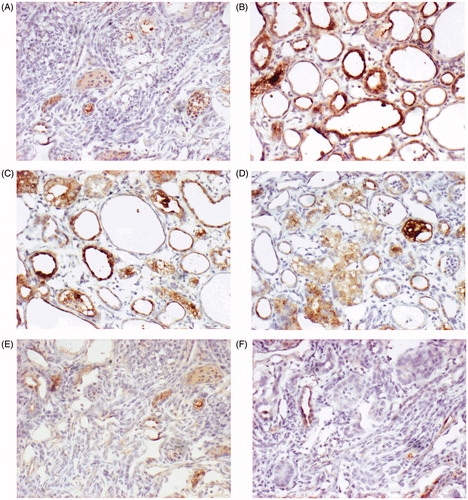
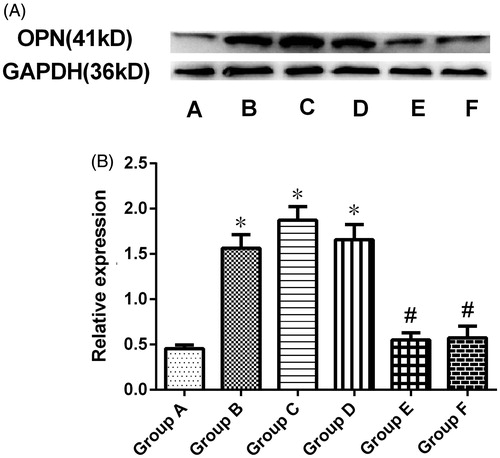
Figure 5. Western blots for OPN expression. (A) Renal OPN expression was analyzed by Western blotting. (B) Quantitative densitometric analysis of OPN expression. The data are presented as the mean ± SD of three experiments (*p < .05 compared with group A, #p < .05 compared with group B, and $p < .05 for group F compared with group E).