Figures & data
Table 1. Effect of coenzyme Q10, sitagliptin or combination of both on body weight and kidney weight.
Figure 1. Effect of coenzyme Q10, sitagliptin or combination of both on (A) urinary protein and (B) urine volume. Values are expressed as mean ± SEM; n = 6; a vs. b, ###p < .001; b vs. c, b vs. d and b vs. e, **p < .01, ***p < .001; c vs. e, +++p < .001; d vs. e, $p < .05, $$p < .01.
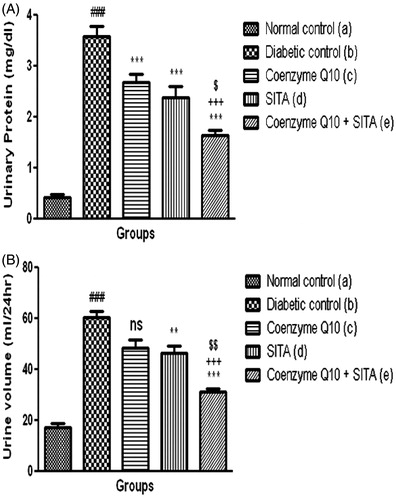
Figure 2. Effect of coenzyme Q10, sitagliptin or combination of both on (A) glycated hemoglobin (B) serum creatinine (C) serum urea and (D) serum uric acid. Values are expressed as mean ± SEM; n = 6; a vs. b, ###p < .001; b vs. c, b vs. d and b vs. e, *p < .05, **p < .01, ***p < .001; c vs. e, ++p < 0.01, +++p < 0.001; d vs. e, $p < .05, $$p < .01.
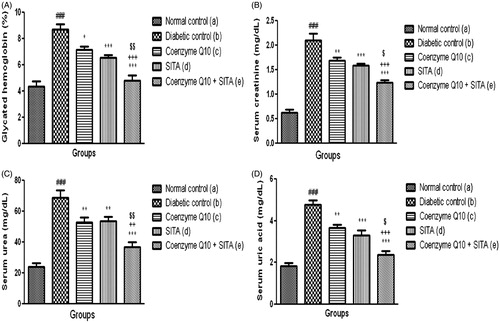
Figure 3. Effect of coenzyme Q10, sitagliptin or combination of both on (A) total cholesterol (B) triglyceride and (C) HDL-C. Values are expressed as mean ± SEM; n = 6; a vs. b, ###p < .001; b vs. c, b vs. d and b vs. e, *p < .05, **p < .01, ***p < .001.
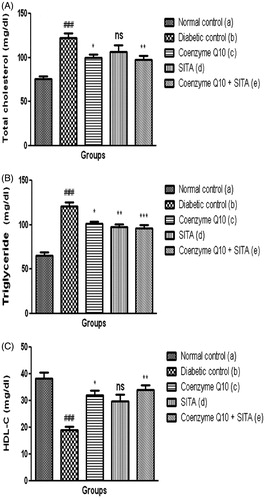
Figure 4. Effect of coenzyme Q10, sitagliptin or combination of both on (A) MDA (B) SOD (C) Catalase and (D) GSH. Values are expressed as mean ± SEM; n = 6; a vs. b, ###p < .001; b vs. c, b vs. d and b vs. e, *p < .05, **p < .01, ***p < .001; d vs. e, $p < .05, $$p < .01.
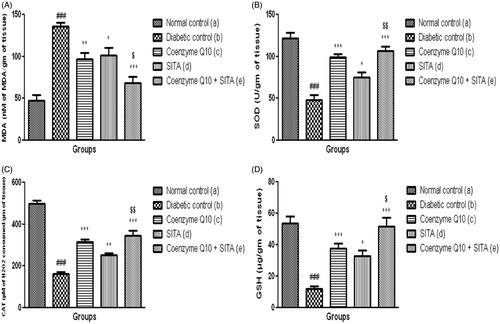
Figure 5. Effect of coenzyme Q10, sitagliptin or combination of both on (A) TNF-α (B) TGF-β (C) MPO and (D) NO. Values are expressed as mean ± SEM; n = 6; a vs. b, ###p < .001; b vs. c, b vs. d and b vs. e, *p < .05, **p < .01, ***p < .001; c vs. e +p < .05, ++p < .01; d vs. e, $p < .05.
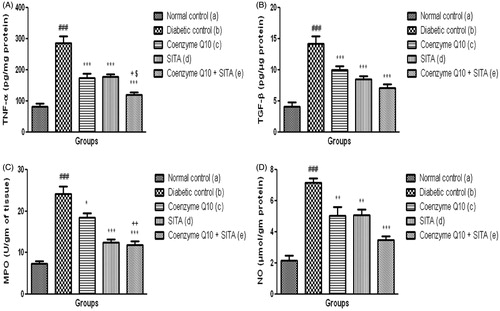
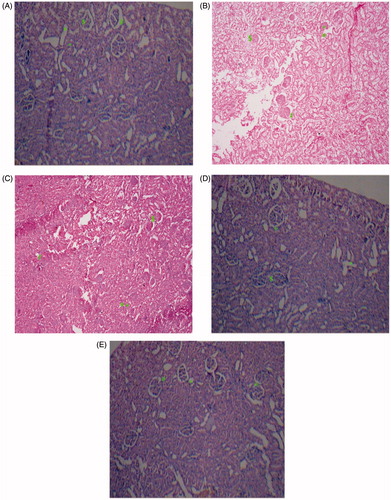
Figure 6. Light microscopy of kidney tissues from rats (HE stained kidney sections). (A) Control group, (B) Diabetic control group, (C) Coenzyme Q10 (D) Sitagliptin (E) Coenzyme Q10 + Sitagliptin.