
Figures & data
Table 1. General characteristics and results of inflammatory markers of the patients in the GPA and the control groups.
Figure 1. ROC analysis for NLR (AUC was 0.906 for >2.9 of NLR with 75% sensitivity, 100% specificity).
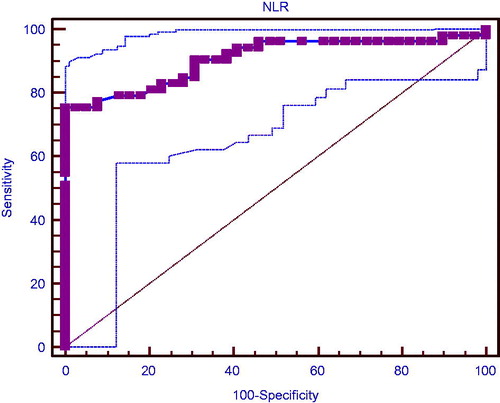
Figure 2. Baseline NLR correlated with serum creatinine level at baseline (Spearman’s rho. = 0.487, p < .001). Moreover, there was also a significant inverse correlation between baseline NLR and GFR at 6-month follow-up (Spearman’s rho = −0.296, p = .005).
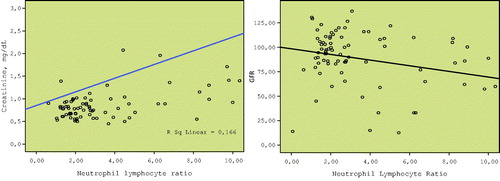
Table 2. Comparison of patients in the renal and non-renal subgroups of the GPA patients at baseline.
Table 3. Comparison of GPA patients who have active or persistent disease with those in remission at 6-month follow-up according to the BVAS system.