
Figures & data
Table 1. Main characteristics of studies included in the meta-analysis.
Table 2. Quality assessment for all the included studies.
Figure 1. Flowchart showing the study selection.
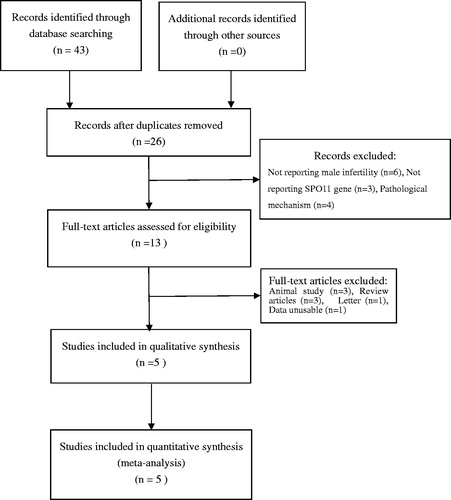
Figure 2. Forest plot of the studies assessing the association between SPO11 C631T gene polymorphisms and male infertility (subgroup analyses for the Iranian and Chinese: allele model: T vs. C).
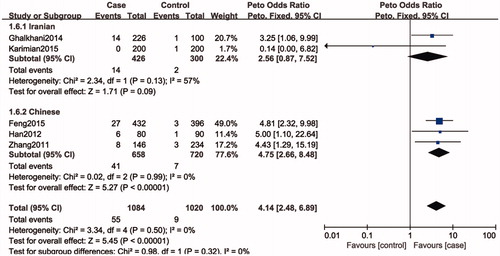
Figure 3. Forest plot of the studies assessing the association between SPO11 C631T gene polymorphisms and male infertility (subgroup analyses for the Iranian and Chinese: codominant model: CT vs. CC).

Figure 4. Forest plot of the studies assessing the association between SPO11 C631T gene polymorphisms and male infertility (subgroup analyses for the Iranian and Chinese: dominant model: TT + CT vs. CC).
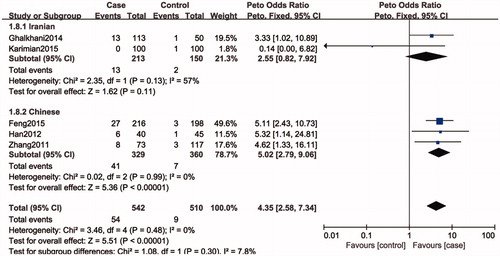
Figure 5. Funnel plot of the studies assessing the association between SPO11 C631Tgene polymorphisms and male infertility (allele model: T vs. C).
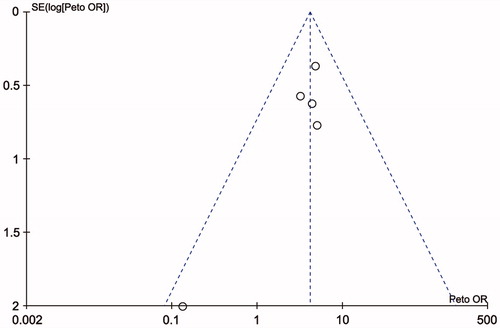
Figure 6. Sensitivity analysis diagram for each study used to assess the relative risk estimates for the SPO11 C631T gene polymorphism and male infertility in all the included studies (allelic model: T allele vs. C allele).
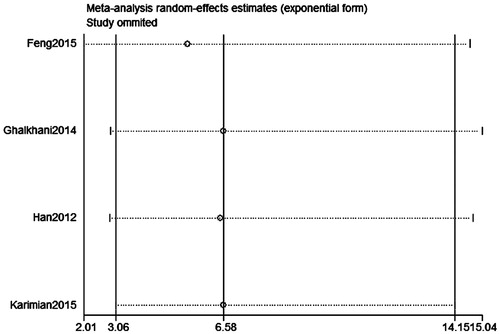
Figure 7. Sensitivity analysis diagram for each study used to assess the relative risk estimates for the SPO11 C631T gene polymorphism and male infertility in all the included studies (codominant model: CT vs. CC).
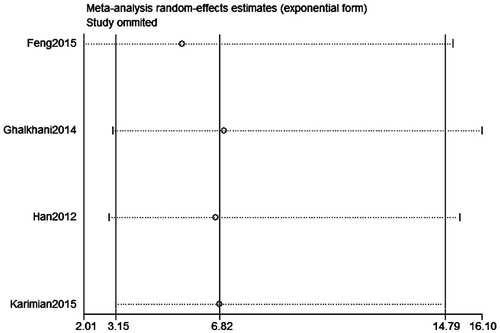
Table 3. Publication bias test for SPO11 C631T polymorphism.