Figures & data
Figure 1. The serum BUN (A) and creatinine (B) levels of all the experimental groups. Means in the same column with the same letter are not significantly different; means in the same column with different letters indicate significant differences between the groups.
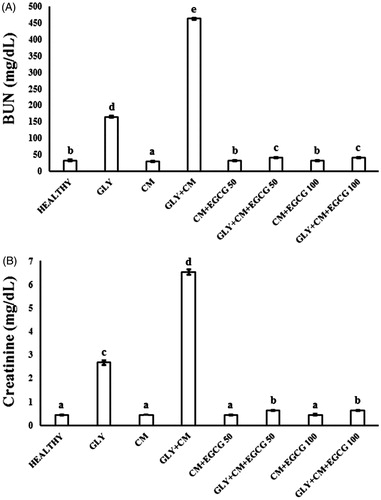
Figure 2. The tissue SOD activities (A), GSH (B) and MDA (C) levels of all the experimental groups. Means in the same column with the same letter are not significantly different; means in the same column with different letters indicate significant differences between the groups.
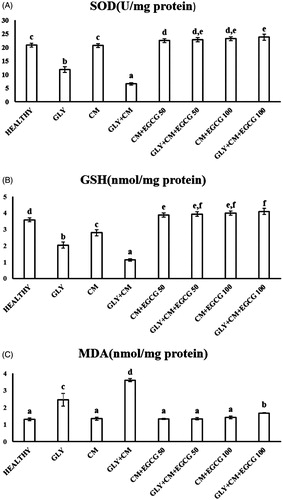
Figure 3. The tissue TNF-α (A) and NF-κB (B) mRNA expressions of all the experimental groups. Means in the same column with the same letter are not significantly different; means in the same column with different letters indicate significant differences between the groups.
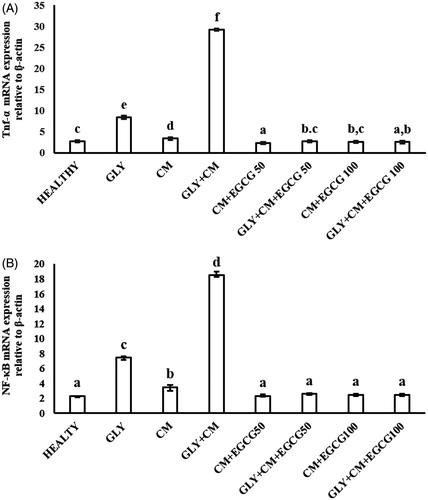
Figure 4. Hematoxylin and eosin results in rats’ kidney tissues; magnification 100X. A: Healthy B: GLY C: CM D: GLY + CM E: CM + EGCG 50 F: GLY + CM + EGCG 50 G: CM + EGCG 100 H: GLY + CM + EGCG 100
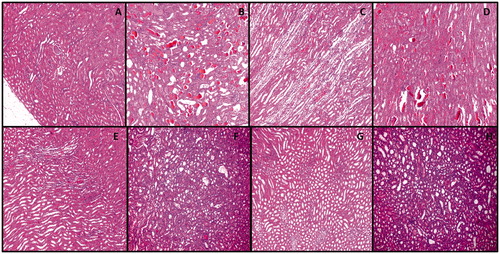
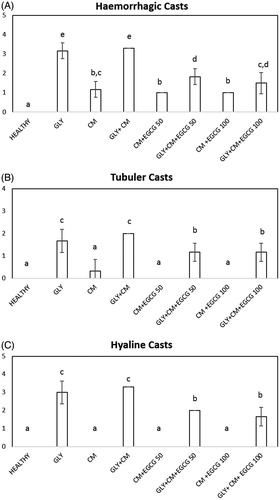
Figure 5. Effects of EGCG on histopathological hemorrhagic cast (A) tubular casts (B) and hyaline cast (C) scores in rats’ kidneys. Means in the same column by the same letter are not significantly different from the test of Duncan (p = .05). Results are expressed as means ± SD (n = 6).