Figures & data
Figure 1. The transfection efficiency of IMD in vivo and in vitro. (A) IMD mRNA expression measured by quantitative RT-PCR in the obstructed kidney of UUO rats. (B) Representative IMD protein expression measured by Western blot in the obstructed kidney of UUO rats. (C) Densitometric quantifications of band intensities from Western blot for IMD/β-actin in the obstructed kidney of UUO rats. (D) IMD mRNA expression measured by quantitative RT-PCR in NRK-52E cells. (E) Representative IMD protein expression measured by Western blot in NRK-52E cells. (F) Densitometric quantifications of band intensities from Western blot for IMD/β-actin in NRK-52E cells. Data in bar graphs are means ± SD, n = 6. *p < .05 versusthe sham (control) group; #p < .05 versus the empty vector (empty plasmid) group.
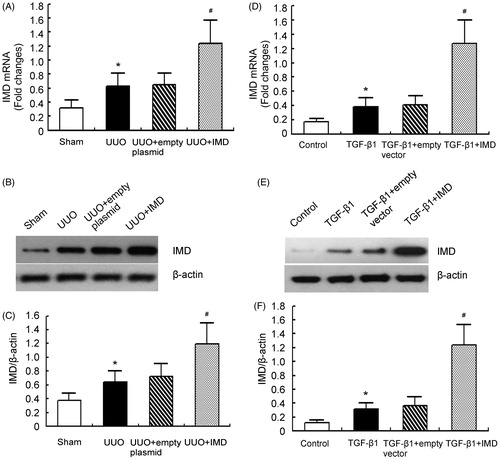
Figure 2. IMD inhibits ROS production in the kidney after UUO. (A) The level of tubulointerstitial superoxides measured by DHE staining. Data in bar graphs are means ± SD, n = 6. *p < .05 versus the sham control group; #p < .05 versus the UUO group. (B) Respective immunofluorescence staining of 4-hydroxynonenal (4-HNE). Original magnification, ×400. Scale bars: 50 μm.
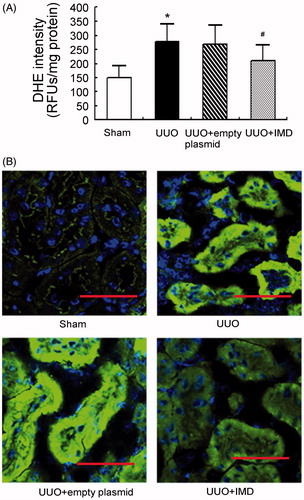
Figure 3. IMD inhibits NADPH oxidase Nox4 expression induced by UUO. (A) Nox4 mRNA expression measured by quantitative RT-PCR in the obstructed kidney of UUO rats. (B) Representative Nox4 protein expression measured by Western blot in the obstructed kidney of UUO rats. (C) Densitometric quantifications of band intensities from Western blot for Nox4/β-actin in the obstructed kidney of UUO rats. Data in bar graphs are means ± SD, n = 6. *p < .05 versus the sham control group; #p < .05 versus the UUO group.
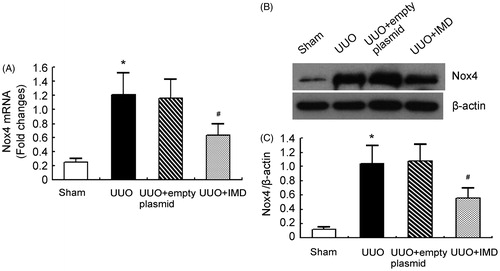
Figure 4. IMD attenuates UUO-induced elevation of NADPH oxidase activity. Data in bar graphs are means ± SD, n = 6. *p < .05 versus the sham control group; #p < .05 versus the UUO group.
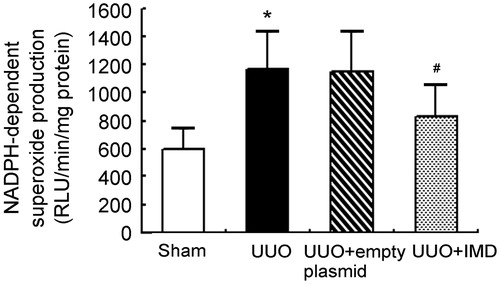
Figure 5. TGF-β1-induced Nox4 expression is abolished by IMD gene-transfer via PKA-dependent pathway. (A) Nox4 mRNA expression measured by quantitative RT-PCR in NRK-52E. (B) Representative Nox4 protein expression measured by Western blot in NRK-52E. (C) Densitometric quantifications of band intensities from Western blot for Nox4/β-actin in NRK-52E. Data in bar graphs are means ± SD, n = 6. *p < .05 versus control group; #p < .05 versus the TGF-β1 group; †p < .05 versus the TGF-β1 + IMD group.
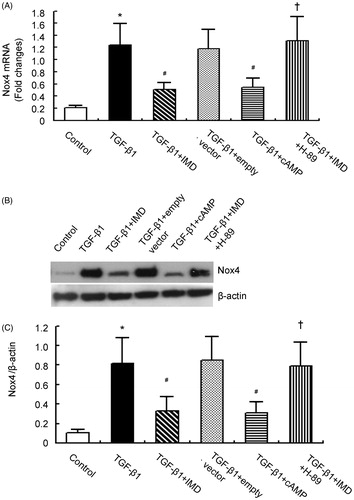
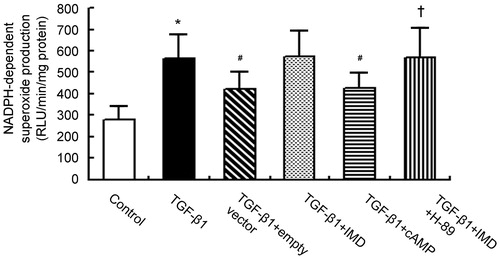
Figure 6. TGF-β1-simulated NADPH oxidase activation is abolished by IMD gene-transfer via cAMP-PKA-dependent pathway. Data in bar graphs are means ± SD, n = 6. *p < .05 versus the control group; #p < .05 versus the TGF-β1 group; †p < .05 versus the TGF-β1 + IMD group.