
Figures & data
Figure 1. Patients recruitment flowsheet.
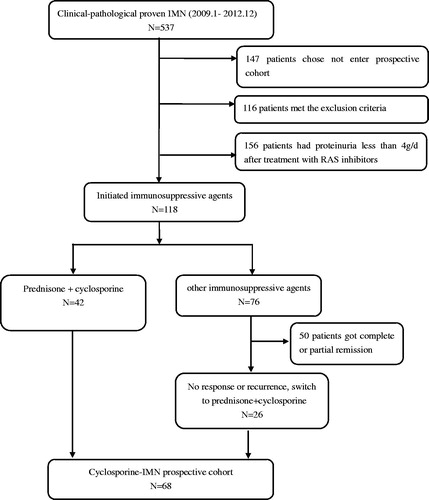
Figure 2. (a) The eGFR change in patients with Non-CsA-RI, CsA-ARI and CsA-CRI during the first four years of follow-up. (b) The SCr change in patients with Non-CsA-RI, CsA-ARI and CsA-CRI during the first four years of follow-up.
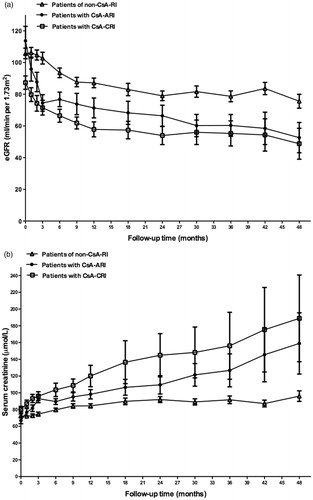
Table 1. Comparison on demographic data and general data among non-CsA-RI, CsA-ARI and CsA-CRI groups.
Figure 3. The cumulative renal survival percentage of all 68 patients, patients with CsA-ARI, patients with CsA-CRI and patients in Non-CsA-RI group.
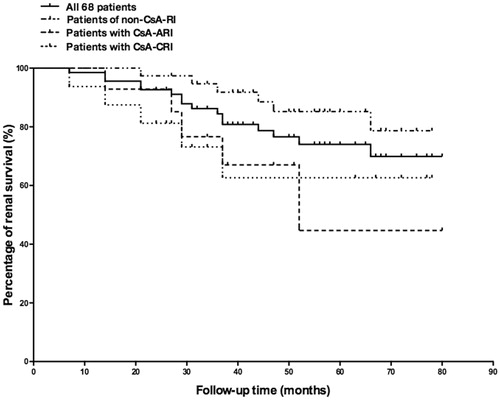
Table 2. Univariate and multivariate analysis for renal endpoint.
Table 3. Comparison on baseline and overtime clinical-pathological data among patients with different time-average proteinuria.