Figures & data
Figure 1. Serum biochemistry of kidney injury biomarkers in sulfasalazine-treated animals. SSZ: sulfasalazine. Data are expressed as mean ± SD (n = 8). Asterisks indicate significantly different as compared with control group (**p < .01 and ***p < .001).
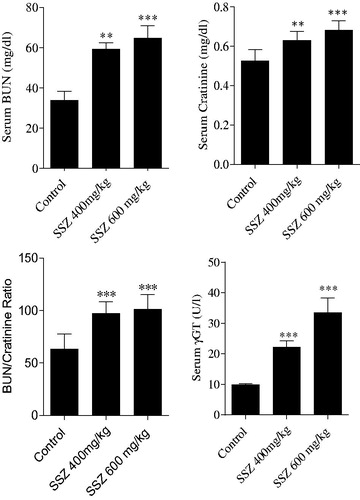
Figure 2. Animals weight gain (A) and kidney weight (B) were assessed after 14 d of sulfasalazine administration. SSZ: sulfasalazine. Data are given as mean ± SD (n = 8). Asterisks indicate significantly different as compared with control animals (*p < .05 and ***p < .001). Superscript “ns” indicates not significant as compared to control group (p > .05).
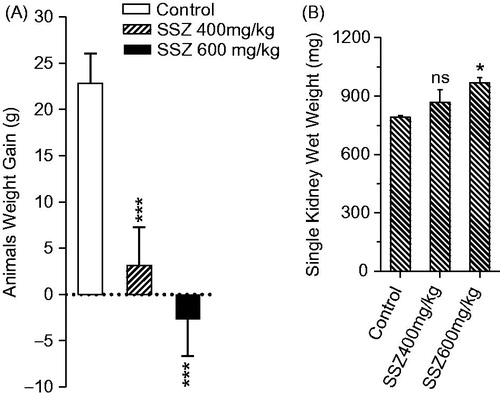
Figure 3. Kidney mitochondrial succinate dehydrogenase activity (SDA) (MTT assay) and photomicrographs of kidney histopathological changes in sulfasalazine-treated animals. MTT test revealed a significant decrease in mitochondrial SDA in the kidney of sulfasalazine-treated animals (mean ± SD, n = 8, and ***p < .001). Kidney photomicrographs showed tubular atrophy, necrosis, and interstitial inflammation in sulfasalazine-treated animals (B, C, and D) in comparison with control group (A). A: control (vehicle-treated), B: sulfasalazine 400 mg/kg/day); C and D: sulfasalazine 600 mg/kg/day).
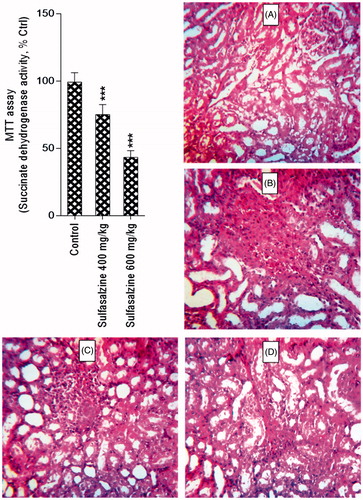
Table 1. Kidney tissue ROS formation, lipid peroxidation, total antioxidant capacity, and glutathione content.
Table 2. Renal injury score in sulfasalazine-treated rats.
Figure 4. Mitochondrial depolarization (A), swelling (B), and ROS formation (C) in the kidney of sulfasalazine-treated animals. SSZ: sulfasalazine. Data are given as mean ± SD (n = 8). Asterisks indicate significantly different as compared with control group (*p < .05, **p < .01, and ***p < .001). Superscript “ns” indicates not significant as compared to control group (p > .05).
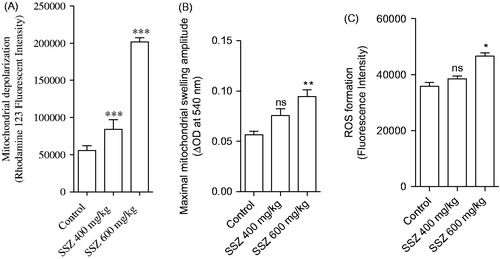
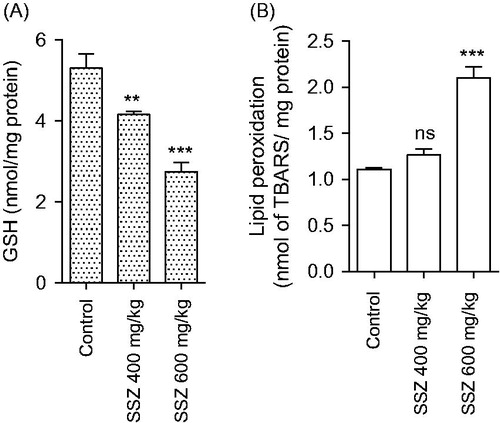
Figure 5. Mitochondrial glutathione content (A) and lipid peroxidation (B) in the kidney of sulfasalazine-treated animals. SSZ: sulfasalazine. Data are given as mean ± SD (n = 8). Superscript “ns” indicates not significant as compared to control. Asterisks indicate significantly different as compared to control (**p < .01 and ***p < .001).