Figures & data
Figure 1. Flow diagram of the current systematic review.
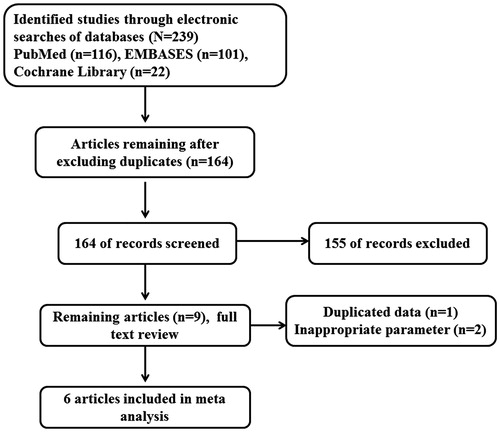
Table 1. Characteristics of included studies.
Table 2. Assessment of the risk of bias in each study using the Newcastle–Ottawa scale (NOS) and the Jadad scaleTable Footnotea.
Figure 2. Forest plot comparing mortality between the body composition monitor use group and the control group for overhydration. A random-effects model pooling of the results showed that detection of OH using BCM was significantly associated with an increased mortality (OR, 1.79; 95% CI, 1.53–2.80).
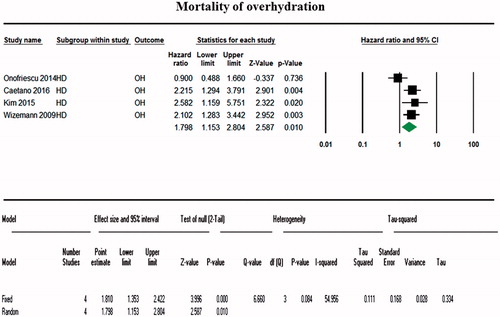
Figure 3. Funnel plots for overhydration and lean tissue index.
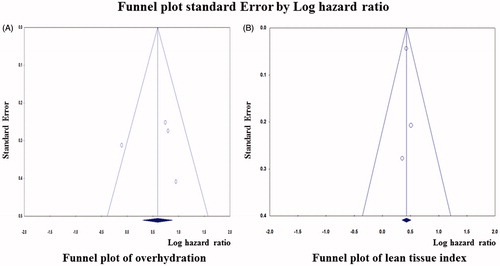
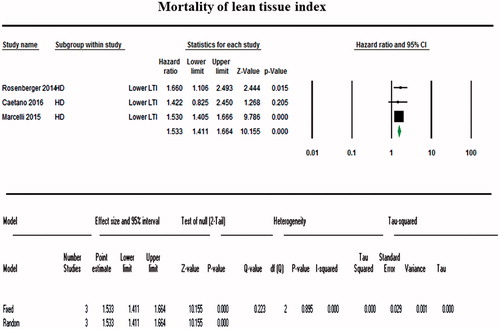
Figure 4. Forest plot comparing mortality between the body composition monitor use group and the control group for low lean tissue index. Low LTI measured using BCM was associated with a significantly increased mortality (OR, 1.533; 95% CI, 1.411–1.644).