Figures & data
Figure 1. Flow chart of the study.
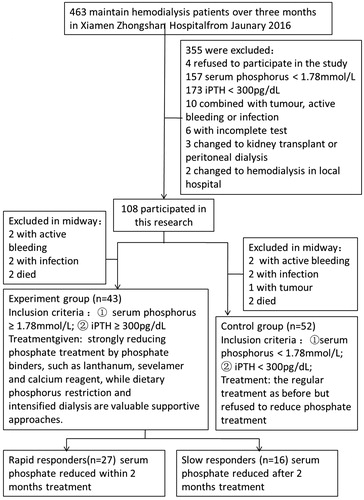
Table 1. Characteristics of the study population.
Figure 2. Serum phosphorus and iPTH before and after phosphorus-lowering therapy. (A) Serum phosphorus was significantly lower in the treatment group compared with the control group. (B) Percent change in serum phosphorus after treatment relative to the baseline. (C) iPTH was significantly lower in the treatment group compared with the control group. (D) Percent change in iPTH level after treatment relative to the baseline. *p < .05.
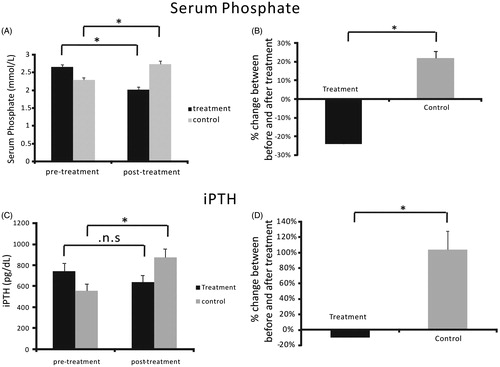
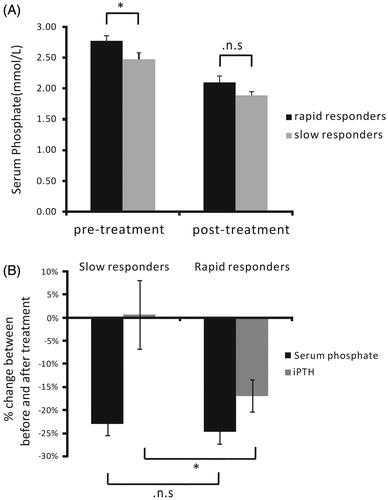
Figure 3. Percent changes in serum phosphorus and iPTH between the rapid responders and the slow responders treatment subgroups. (A) The basal serum phosphorus concentrations before treatment of the rapid responders was significant higher than the slow responders subgroups (p = .0275, A). (B) The percent of change in serum phosphorus was −23.07 ± 2.45% in the rapid responders treatment subgroup and −24.68 ± 2.73% in the slow responders treatment subgroup (p > .05). The percent of change in iPTH in the rapid responders treatment subgroup was −16.93 ± 3.49%, in contrast with 0.68 ± 7.37% in the slow responders treatment subgroup. *p < .05.