Figures & data
Figure 1. Histological examination of mouse kidney. Male C57BL/6 mice were fed a normal diet (ND; A,C) or high-cholesterol diet (HCD; B,D) for 11 weeks. (A,B) Representative micrographs showing Masson’s trichrome staining. Arrowhead: Bowman’s space. (C,D) Representative micrographs showing immunostaining with megalin (proximal tubule marker, dark staining). Arrow: tubular epithelium lining of the proximal tubules which are contiguous with Bowman’s capsule. Box area is enlarged to compare HCD with ND (lower panels). Scale bars: 50 μm.
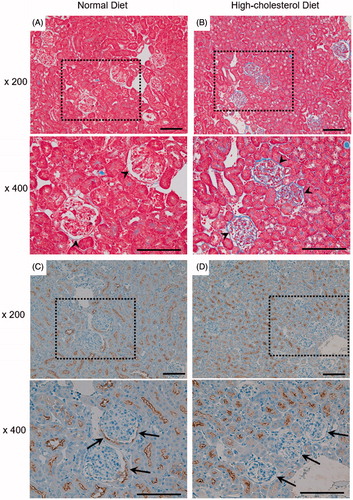
Figure 2. Western blot of megalin in mouse kidney homogenate and effects of βVLDL on megalin in kidney derived cultured cells. (A) Male C57BL/6 mice (n = 7 per group) were fed normal diet or high-cholesterol diet for 12 weeks. Kidney extracts were used to determine the protein levels of megalin by Western blot. (B) LLC-PK1 was incubated for the indicated number of days with or without 0.2 mg TC/mL βVLDL. (C) HRMC and HRPTEC were incubated with or without 0.2 mg TC/mL βVLDL for two days in triplicate. Each bar represents the mean ± SE, *p < .01, ***p < .001, as compared with control.
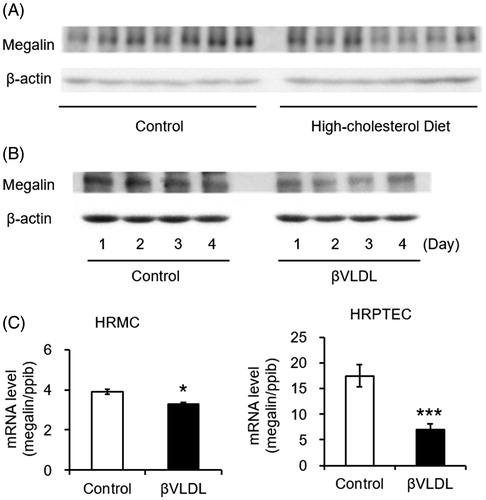
Figure 3. Effect of βVLDL on cellular proliferation and cholesterol accumulation. Cells were incubated with or without 0.2 mg TC/mL βVLDL for the indicated number of days. The cell number was counted. (A) MES 13; (B) LLC-PK1. Each point represents the mean ± SE. (C,D) Cells were incubated for two days with or without 0.2 mg TC/mL βVLDL. Intracellular TC and FC were determined by enzymatic colorimetric assays. The concentration of CE was determined by subtracting FC from TC (E). Each bar represents the mean ± SE from triplicates. *p < .05, **p < .01, as compared with control.
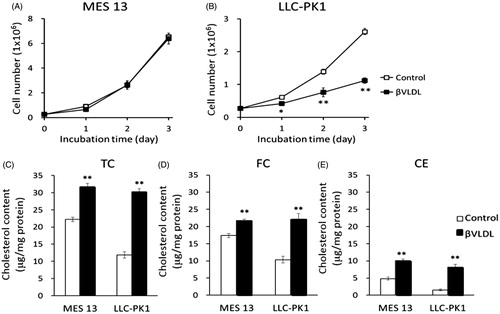
Table 1. Dose-dependent accumulation of lipid in MES 13 and LLC-PK1 cells.
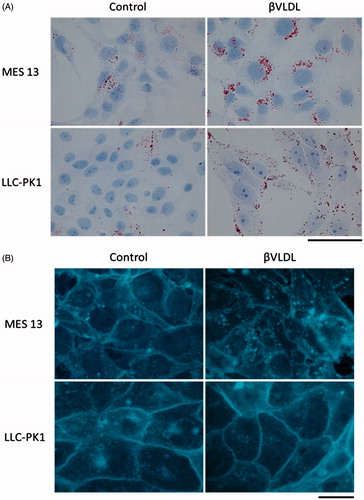
Figure 4. Localization of neutral lipid and FC in MES 13 and LLC-PK1 cells loaded with βVLDL. (A) The intracellular distribution of neutral lipid was examined using Oil Red O staining. (B) The intracellular distribution of FC was examined using filipin staining. Cells were incubated for two days with or without 0.2 mg TC/mL βVLDL. Bar; 20 μm.