Figures & data
Figure 1. Two-way hierarchical clustering heat map of DEGs. The horizontal axis represents the different samples, the vertical axis represents the genes and the white to black represents the genes expression changed; the deeper the color, the high the expression levels. DEGs: differentially expressed genes.
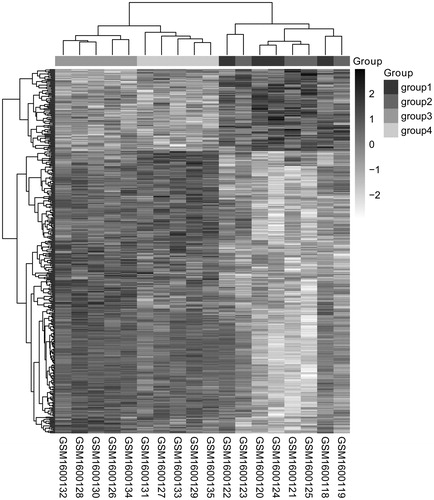
Table 1. Results of enrichment analysis of DEGs.
Figure 2. The PPI network of DEGs. Round represents the upregulated DEG; quadrilateral represents down-regulated DEG and the line represents the interaction. DEG: differentially expressed gene.
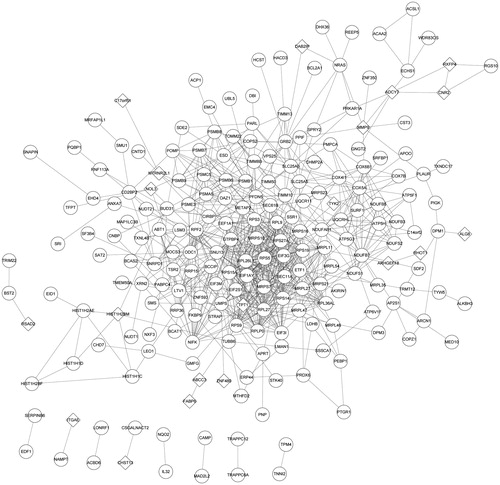
Table 2. Genes with node degree greater than 20 in PPI network.
Figure 3. The GO correlation of highest score sub-modules. Gray nodes represent the significant GO terms and white nodes represent the non-significant GO terms. Node in a larger node size and a darker color represents a more significant GO term; arrows indicate relevancy of the two GO terms. GO: gene ontology.
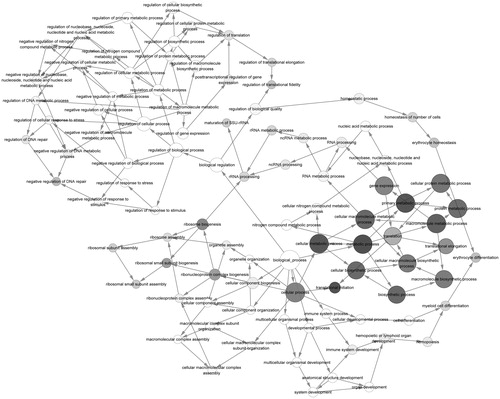
Figure 4. GO enrichment of the highest score sub-modules. Round nodes represent the upregulated genes; quadrilateral nodes represent down-regulated genes and the lines represent the interactions between the two nodes. White nodes represent these genes that are not significantly enriched in the pathway; the different colors are marked as specific GO classifications, blue: gene expression; purple: cellular macromolecule bio synthetic process; red: macromolecule biosynthetic process; rose red: translation and orange: translational elongation. GO: gene ontology (refer online version for color figure).
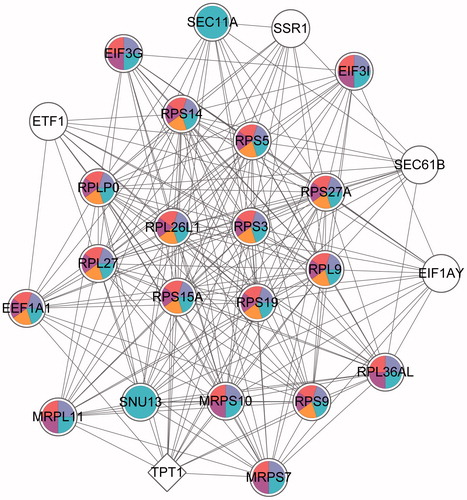
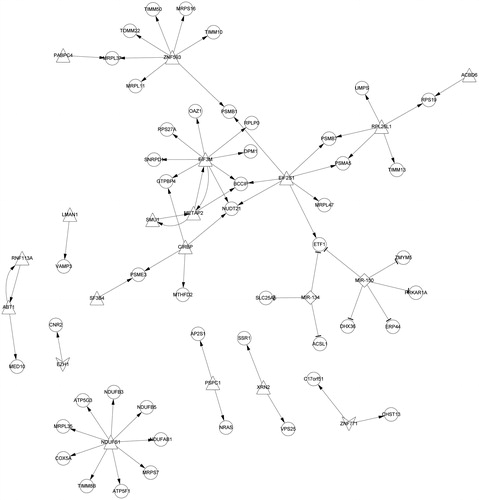
Figure 5. MiRNA-TF-DEGs regulatory network. The triangle nodes represent the up-regulated TFs; the quadrilateral nodes represent the down-regulated TFs; the arrow is the regulation relation; the circle nodes represent the target genesand diamond is the miRNA. DEG: differentially expressed gene; TF: transcription factor.