Figures & data
Figure 1. Flowchart of study participants.
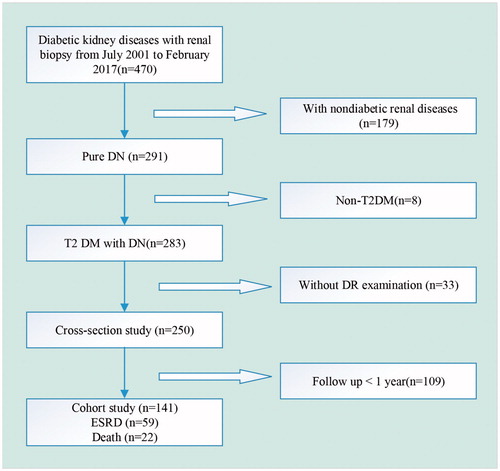
Figure 2. Representative examples of different glomerular classes in DN. (A) Mild changes by light microscopy (Class I). (B) GBM thickening by electron microscopy (Class I, scale bar = 2.0 μm). (C) Mild mesangial expansion (Class IIa). (D) Severe mesangial expansion (Class IIb). (E) Kimmelstiel–Wilson lesion (Class III). (F) Global glomerulosclerosis (Class IV).
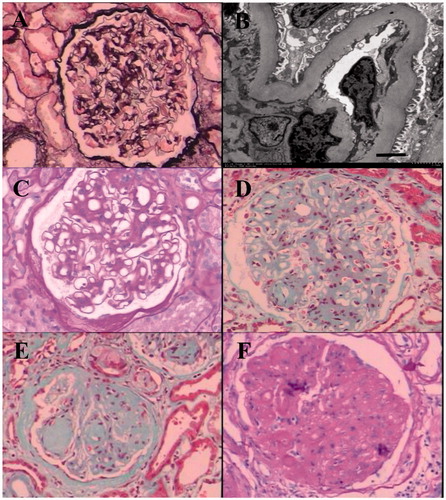
Table 1. Baseline demographics in the cross-section and cohort studies.
Table 2. Pathological findings according to diabetic retinopathy.
Figure 3. Risk factors for DR identified by multivariate binary logistic regression analysis. Ref indicated reference group. aAdjusting for baseline proteinuria, hematuria, e-GFR, and interstitial inflammation.
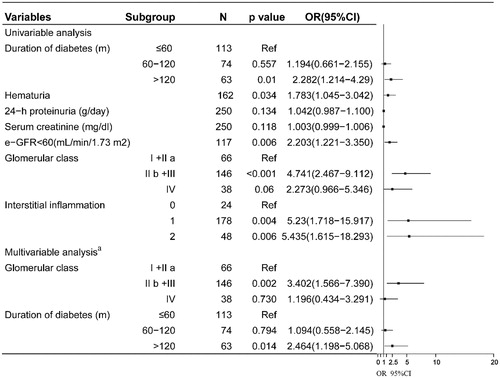
Figure 4. Kaplan–Meier curves of renal survival rate in DN patients with or without DR.
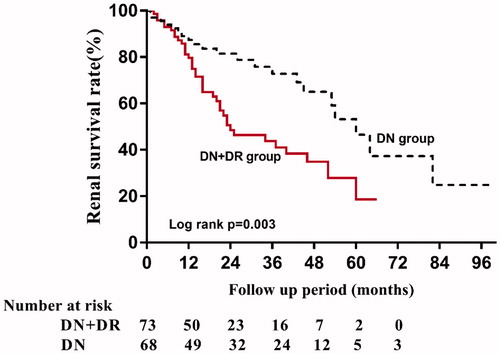
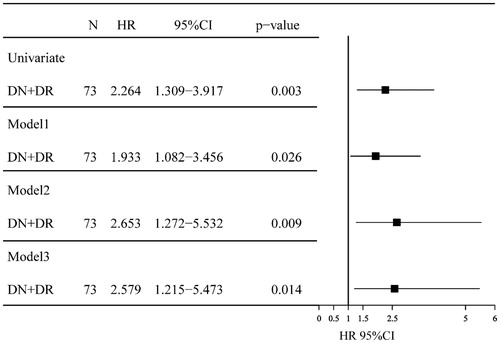
Figure 5. HRs of progression to ESRD for the patients with DN + DR versus DN only in the cohort study using univariate/multivariate COX hazard analysis. CI: confidence interval; HR: hazard ratio; Model 1: adjusted for age, gender, hypertension, cigarette smoking and the duration of T2DM at the time of renal biopsy; Model 2: adjusted for all of the above covariates plus HbA1c, hematuria and serum creatinine; Model 3: adjusted for the clinical variables in model 2 and other renal pathological findings, such as the glomerular class and interstitial inflammation score.