Figures & data
Figure 1. Study flow diagram of the meta-analysis.
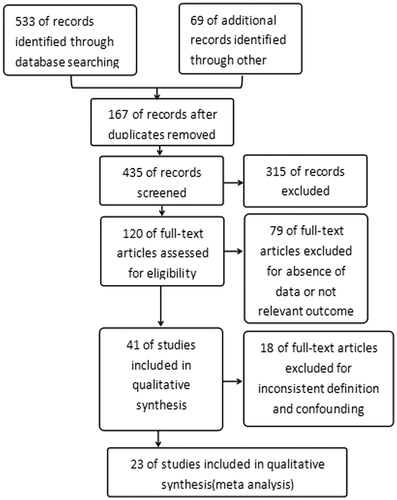
Table 1. Twenty-three Studies included in qualitative synthesis.
Figure 2. Forest plot.
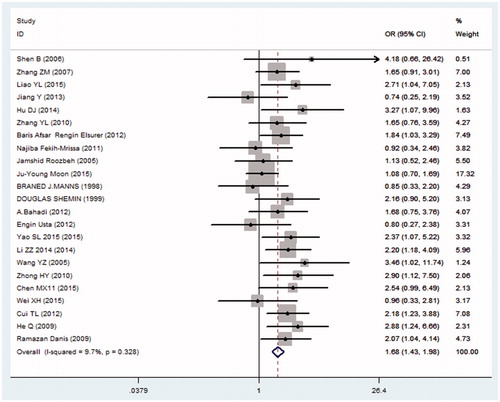
Figure 3. Funnel plot with pseudo 95% confidence limits.
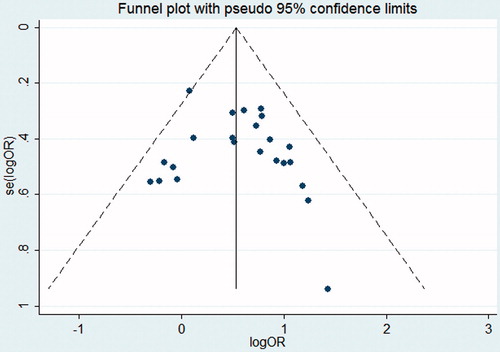
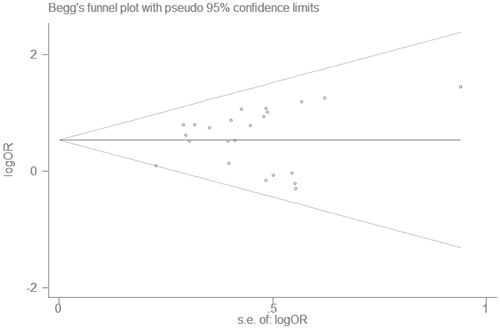
Figure 4. Begg’s funnel plot.
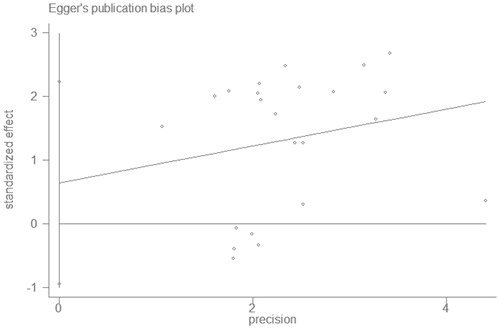
Figure 5. Egger’s funnel plot.