
Figures & data
Table 1. Basic demographic, clinical, and biochemical characteristics in examined groups and in healthy controls.
Figure 1. The correlation between MDA and AST/ALT in the experimental groups (the correlation between examined parameters was determined by linear regression analysis and ‘goodness of fit’ analysis, as well as by the Pearson’s coefficient of linear correlation). MDA is expressed in µmol/L.
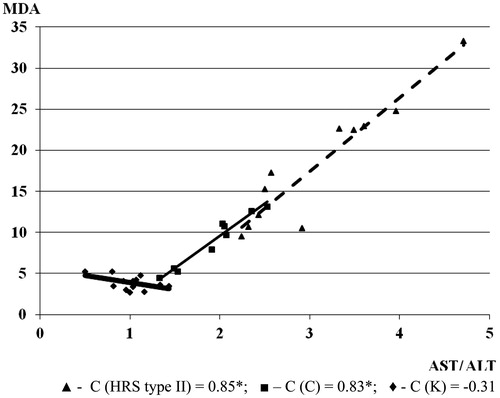
Figure 2. The correlation between MDA and CRP in experimental groups (the correlation between examined parameters was determined by linear regression analysis and ‘goodness of fit’ analysis, as well as using Pearson’s coefficient of linear correlation). MDA is expressed in µmol/L and CRP in mg/L.
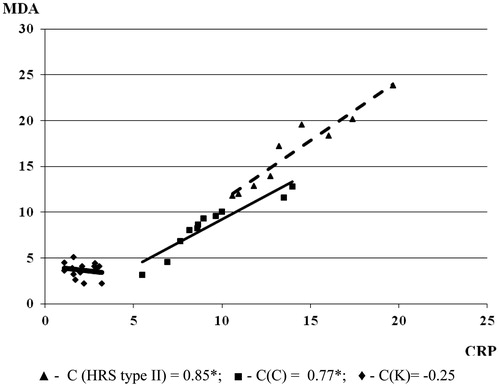
Figure 3. The correlation between MDA and NO2 + NO3 in the experimental groups (the correlation between examined parameters was determined by a linear regression analysis and ‘goodness of fit’ analysis, as well as by Pearson’s coefficient of linear correlation). MDA and NO2 + NO3 are expressed in µmol/L.
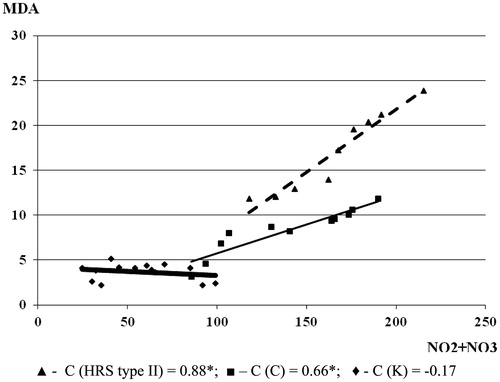
Figure 4. The correlation between MDA and creatinine in the experimental groups (the correlation between examined parameters was determined by a linear regression analysis and ‘goodness of fit’ analysis, as well as by Pearson’s coefficient of linear correlation). MDA and creatinine are expressed in µmol/L.
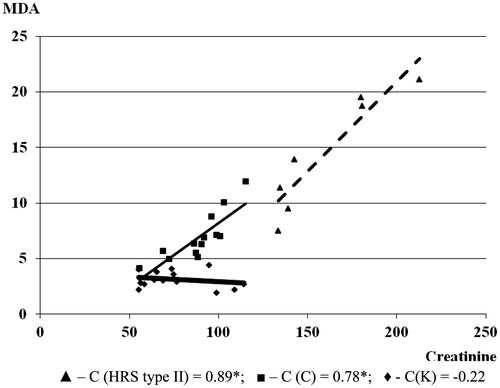
Figure 5. Correlation of MDA and GSH in examined groups (the relationship between investigated parameters was determined by linear regression analysis and ‘goodness of fit’ analysis, as well as using Pearson’s coefficient of linear correlation). The MDA is expressed in µmol/L and glutathione is expressed in µmol/L.
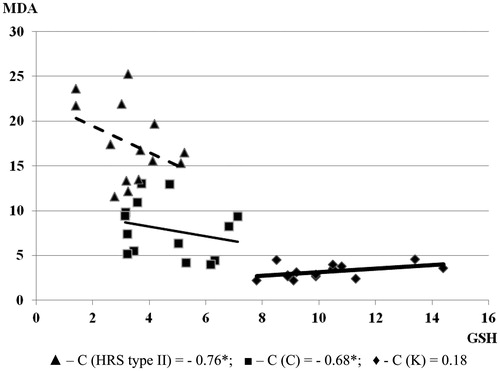
Figure 6. Correlation of MDA and GST in examined groups (the relationship between examined parameters was determined using linear regression analysis and ‘goodness of fit’ analysis, as well as using Pearson’s coefficient of linear correlation). MDA is expressed in µmol/L and glutathione S-transferase is expressed in U/L.
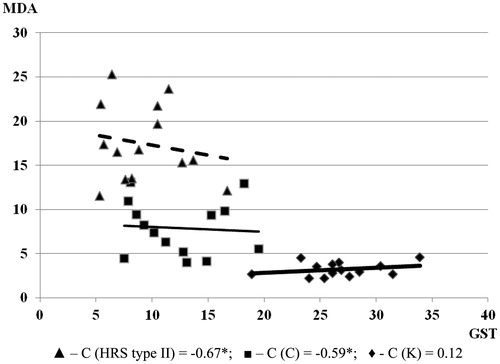
Table 2. Parameters of oxidative stress and antioxidative defense in examined groups and in healthy controls.
Figure 7. Correlation of MDA and arginine in examined groups (the relationship between examined parameters was determined using linear regression analysis and ‘goodness of fit’ analysis, as well as using Pearson’s coefficient of linear correlation). MDA is expressed in µmol/L. L-arginine was expressed in µmol/L.
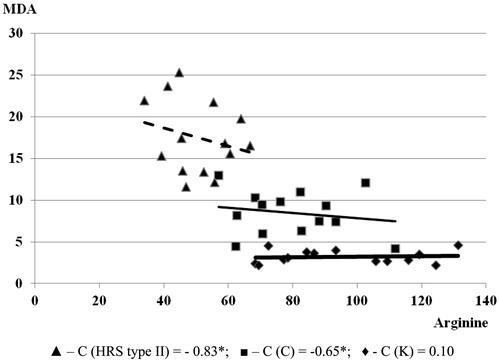
Table 3. L-arginine and NO2 + NO3 in in examined groups and in healthy controls.