
Figures & data
Table 1. Baseline demographic and clinical characteristics.
Table 2. Laboratory data.
Table 3. Angiographic characteristics.
Table 4. Serum levels of SCr, NGAL, and FGF23.
Figure 1. ROC curve of serum NGAL and FGF23, increment percentage between 1 day after PCI and baseline (A), absolute value 1 day after PCI (B). **p < .01.
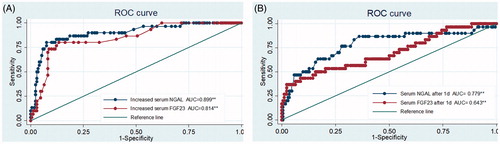
Table 5. Diagnostic characteristics of serum NGAL and FGF23 for CIN.
Figure 2. Correlation between SCr and serum NGAL (A), between eGFR and serum NGAL (B), between SCr and serum FGF23 (C), between eGFR and serum FGF23 (D).
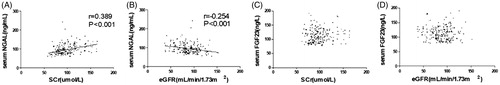
Figure 3. A-G: Shown are clinical models from models A–G.
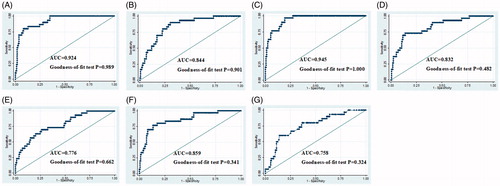
Table 6. Clinical models.