Figures & data
Table 1. Comparison of pretreatment and post-treatment serum creatinine levels.
Figure 1. Comparison of urine N-acetyl-β-d-glucosaminidase levels on day 1, 5, and 10 of treatment (ap = .001 when colistimethate sodium group and sterile saline group were compared on day 10; bp = .0001 when colistimethate sodium group and N-acetylcysteine group were compared on day 10; cp = .001 when colistimethate sodium group and colistimethate sodium + N-acetylcysteine group were compared on day 10; dp = .001 when the 10th day of the treatment was compared with the baseline in the colistimethate sodium group; ep = .0001 when the 10th day of the treatment was compared with the first day in the colistimethate sodium group).
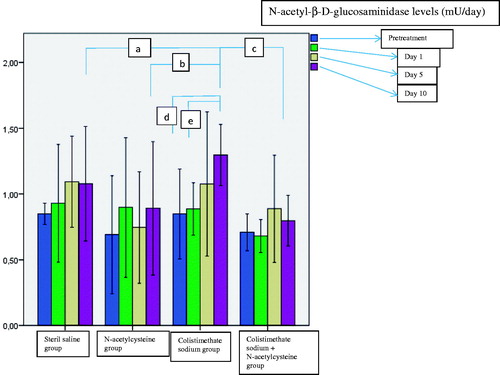
Figure 2. Histological findings of the study: normal kidney structure of the sterile saline group (A), Grade 1 renal histological lesion in N-acetylcysteine group (B), Grade 2 renal histological lesion in colistimethate sodium group (C), Grade 1 renal histological lesion in colistimethate sodium + N-acetylcysteine group (D). Tubular dilatation (asterisk), tubular casts (hollow arrow), and tubular cell necrosis (black arrow) (original magnification ×200).
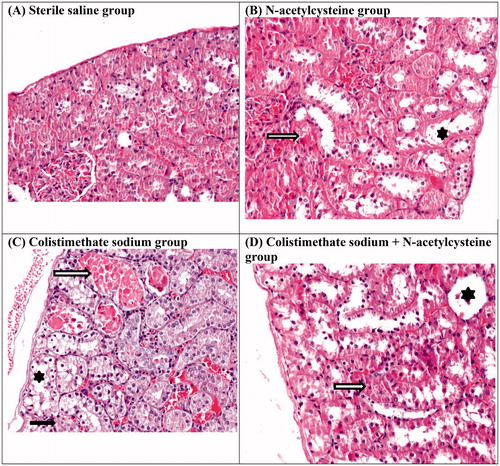
Table 2. TUNEL results and renal histological damage scoring in all experimental groups.
Table 3. The values of renal histological changes among experimental groups.
Figure 3. The results of Western blotting analysis in the renal tissue in the sterile saline group, N-acetylcysteine group, colistimethate sodium group, and colistimethate sodium + N-acetylcysteine group: (A) the expression levels of endothelial nitric oxide synthase (a: p = .03, compared with the sterile saline group; b: p = .0001, compared with the N-acetylcysteine group; c: p = .0001, compared with the colistimethate sodium + N-acetylcysteine group; d: p = .0001, when N-acetylcysteine group and the sterile saline group were compared; e: p = .001, when colistimethate sodium group + N-acetylcysteine group and the sterile saline group were compared); (B) the expression levels of superoxide dismutase 2 (a: p = .0001, compared with the sterile saline group; b: p = .0001, compared with the N-acetylcysteine group; c: p = .002, compared with the colistimethate sodium + N-acetylcysteine group; d: p = .001, when N-acetylcysteine group and the sterile saline group were compared); (C) the expression levels of matrix metalloproteinase 3 (a: p = .007, compared with the sterile saline group; b: p = .0001, compared with the N-acetylcysteine group; c: p = .0001, compared with the colistimethate sodium + N-acetylcysteine group; d: p = .011, when N-acetylcysteine group and the sterile saline group were compared; e: p = .001, when colistimethate sodium group + N-acetylcysteine group and the sterile saline group were compared).
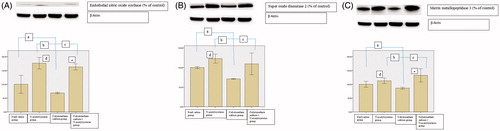
Table 4. Total oxidant and antioxidant status and determination of oxidative stress index levels in renal tissue of the sterile saline, N-acetylcysteine, colistimethate sodium, and N-acetylcysteine + colistimethate sodium-treated groups.
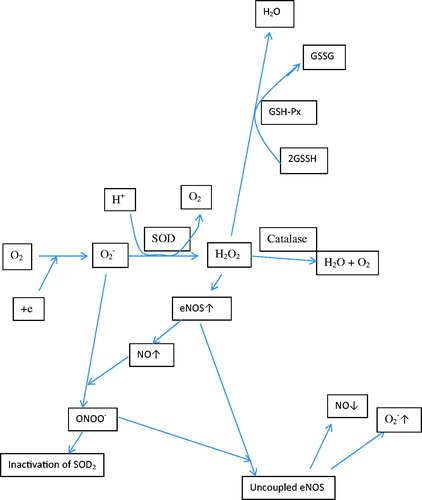
Figure 4. The roles of superoxide dismutase, nitric oxide synthetase, and glutathione in the neutralization of reactive oxygen species formed in the body (O2−: superoxide; SOD: superoxide dismutase; GSH-Px: glutathione peroxidases; NO: nitric oxide; ONOO−: peroxynitrite; H2O2: hydrogen peroxide; eNOS: endothelial nitric oxide synthase; GSSG: oxidized glutathione; GSSH: reduced glutathione).