1,663
Views
18
CrossRef citations to date
0
Altmetric
Clinical Study

The contribution of genetic variants of SLC2A1 gene in T2DM and T2DM-nephropathy: association study and meta-analysis

, ORCID Icon, , , , , , , , , , , , , & show all
Pages 561-576 | Received 07 Nov 2017, Accepted 28 Jun 2018, Published online: 24 Oct 2018

Figures & data

Table 1. Clinical profiles of the study-cohort.

Table 2. Distribution of genotypes of SLC2A1 variants.

Table 3. Association between SLC2A1 gene variants and T2DM- nephropathy for the additive and co-dominant models.

Table 4. The degree of dominance index (h-index).

Table 5. Estimates (D′, r2 and p values) of linkage disequilibrium (LD) between pairs of SLC2A1 variants.

Table 6. Estimated haplotype frequencies for the 14 SLC2A1 variants.

Figure 1. Flowchart showing how studies were selected for meta-analysis.

Figure 1. Flowchart showing how studies were selected for meta-analysis.

Figure 2. Forest plot presenting results of individual studies and pooled estimates from both main and subgroup meta-analyses between diseased controls versus cases.

Figure 2. Forest plot presenting results of individual studies and pooled estimates from both main and subgroup meta-analyses between diseased controls versus cases.

Figure 3. Forest plot presenting results of individual studies and pooled estimates from both main and subgroup meta-analyses between healthy controls versus diseased controls versus cases.

Figure 3. Forest plot presenting results of individual studies and pooled estimates from both main and subgroup meta-analyses between healthy controls versus diseased controls versus cases.

Figure 4. Forest plot presenting results of individual studies and pooled estimates from both main and subgroup meta-analyses between healthy controls versus cases.

Figure 4. Forest plot presenting results of individual studies and pooled estimates from both main and subgroup meta-analyses between healthy controls versus cases.

Table 7. Characteristics of studies included in meta-analysis.

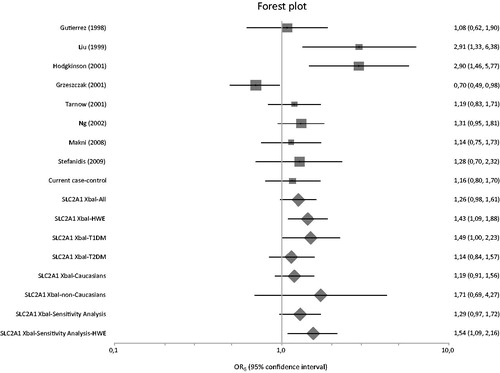
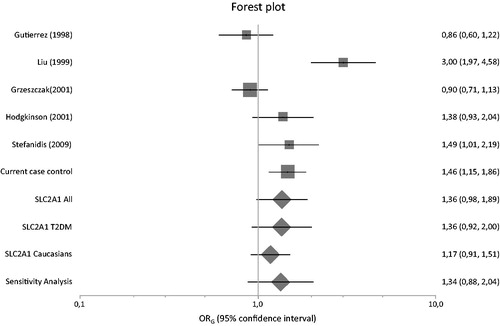
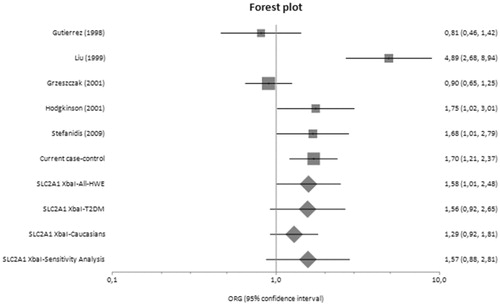
Table 8. Results from meta-analyses based on genotype counts.